
For network administrators, monitoring network performance issues is important, and network monitoring tools can help organizations track and resolve these issues. However, implementing and maintaining a network monitoring solution can be costly. Fortunately, there are many free and open-source solutions on the market, and network administrators need some time and patience to choose carefully.
These open-source tools are released under an open-source license and can be considered if companies want to reduce costs. It should be noted that some may not be suitable for your needs, as many open source tools require expertise. Therefore, here are some of the key features of each open-source tool so that you can understand the benefits of each solution.
Angry IP Scanner
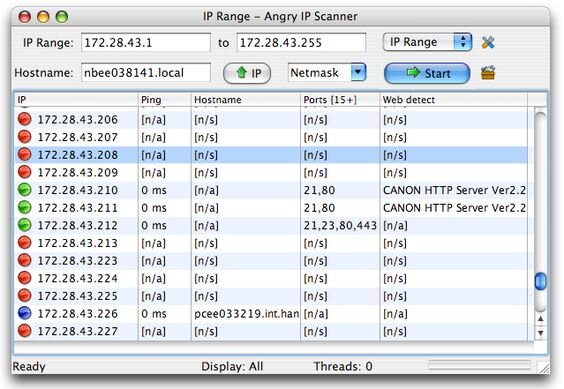
The software scans the IP addresses connected to the network and checks the status and availability of each device. The Angry IP Scanner uses a multi-threaded approach to create separate threads for each scanned IP address; this increases the speed of tool IP monitoring. The tool also supports NetBIOS information, IP address ranges, web server detection and customizable opening tools.
Cacti
Cacti is an open-source network monitoring tool based on the RRDTool data logging and graphics system. The tool uses network polling and data collection to collect device information on networks of any size. This includes designing custom scripts for data collection and the ability to support SNMP polling. It then displays this information in an easy-to-understand graphic that can be arranged in the most appropriate hierarchy of business.
Checkmk
Checkmk is an open-source infrastructure and application monitoring tool that also includes network monitoring capabilities. For network monitoring, Checkmk can discover and monitor switches and routers, wireless networks and firewalls; the software supports integration with multiple network hardware vendors. The solution uses rule-based concepts to configure network and device monitoring, allowing organizations to configure the entire network to monitor specific metrics.
Icinga
Through the web interface, enterprises can observe hosts and applications across the entire network infrastructure. The tool is natively scalable and can be easily configured for a wide range of devices. There are also Icinga modules for specific monitoring functions, such as monitoring VMWare's vSphere cloud environment and business process modeling.
LibreNMS
The LibreNMS API can retrieve, manage and map the data it collects and supports horizontal scaling to enhance its network monitoring capabilities. The tool has a flexible alarm system that can be tailored to the company's approach to communicate with you. They also offer native iOS and Android apps.
Nagios Core
Nagios Core is an open-source network monitoring tool designed to serve as the basis for other monitoring and alerting software provided by Nagios. It is primarily a performance checker that schedules and performs network performance checks across the entire infrastructure. As a performance check event handler for other Nagios software, Nagios Core also extends its capabilities through Naigos Exchange through a separate add-on.
NetXMS
The tool provides flexible event processing, reporting, and visualization of graphics for all layers of the IT infrastructure. For network monitoring, NetXMS provides automatic Layer 2 and Layer 3 discovery as well as full SMNPv3 support. The program also includes active and passive discovery, combining scanning probes and information gathering capabilities.
Ntopng
Ntopng is an open-source network traffic analysis tool with network monitoring capabilities. The tool is a network traffic probe that classifies network traffic into different standards, including IP addresses and throughput. By characterizing network traffic, organizations can easily identify different network statistics that affect the network. Although the community version of ntopng is open source, you can also use the Professional and Enterprise editions.
Pandora FMS
Pandora FMS is an open source monitoring tool that helps companies observe the entire IT infrastructure. It not only has network monitoring capabilities but also Windows and Unix servers and virtual interfaces. For networks, Pandora FMS includes features such as ICMP polling, SNMP support, network latency monitoring, and system overload. You can also install an agent on your device to observe device temperature, as well as log files and other factors.
Prometheus
It allows users to set up network monitoring using the native toolset. The tool is capable of collecting information on devices using SNMP pings and checking network bandwidth usage and other features from a device perspective. The PromQL system analyzes the data and allows the program to generate graphics, tables and other visual effects on the systems it monitors.
Wireshark
Wireshark is an open-source network protocol analyzer with real-time network data capture and analysis capabilities. The tool performs in-depth checks on multiple different network protocols to determine multiple levels of network performance. Wireshark also allows users to capture packets and analyze them even when the network is offline. Data captured by Wireshark can be stored in a variety of common or shared file formats, allowing other tools to help interpret data on the network.
ZABBIX
Zabbix's network monitoring capabilities include performance metrics such as bandwidth usage, packet loss, and CPU/memory utilization. It can also detect network node and connection health issues by examining devices in critical condition. Zabbix can alert you when hardware functionality drops (the network device's fan speed is low) or does not respond to SNMP checks.