Imagine trying to understand how stressed people are in an office. You could measure each employee's heart rate at different times and get hundreds of numbers. Or you could group everyone into three categories: "Calm," "Moderately Busy," and "On the Verge of Burnout." The second picture would be much clearer, right?
Average Pupil Diameter Binned is precisely this approach. It's not just the "average pupil size," but intelligently grouped data that transforms scattered numbers into understandable psychophysiological portraits.
What It Really Is
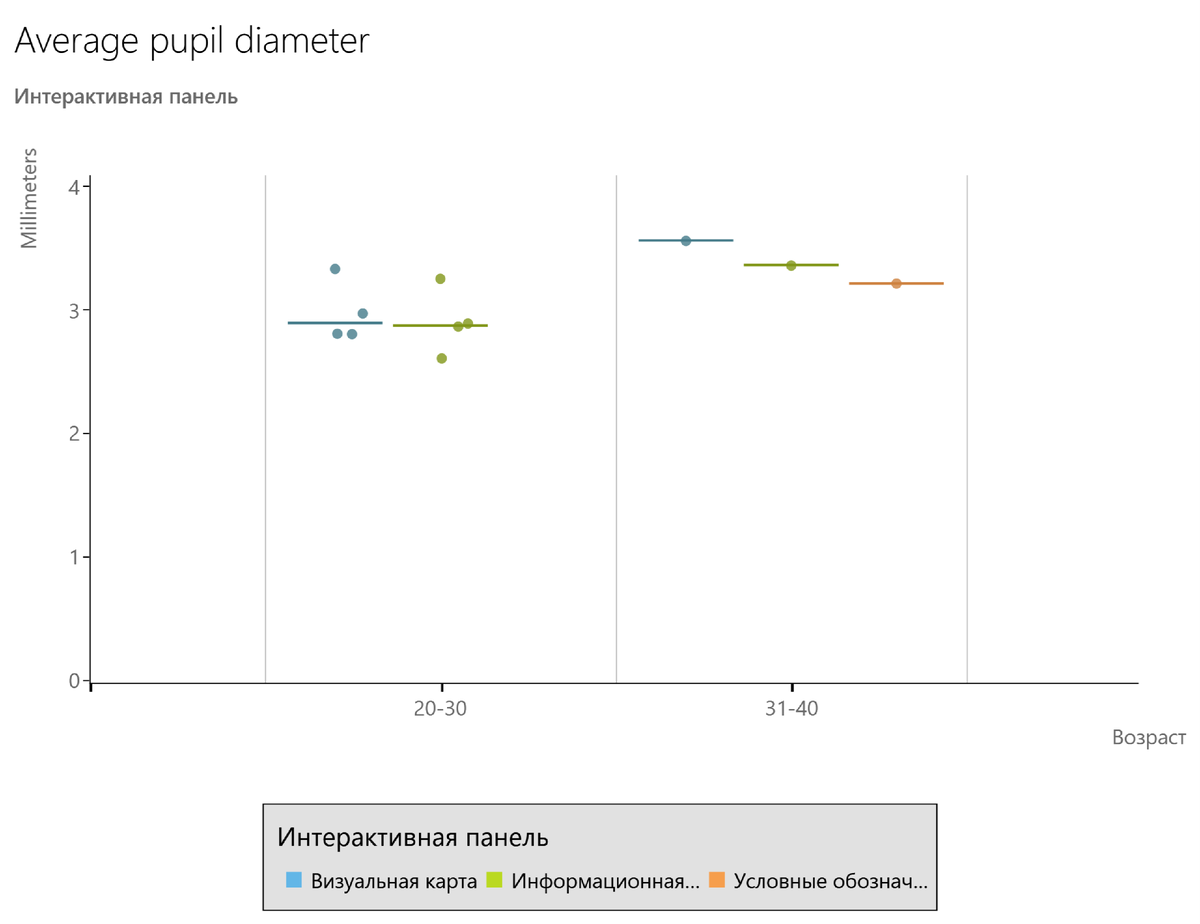
- Average Pupil Diameter: The average size of a participant's pupil over a specific period (e.g., during an entire ad view). This is the raw, but "noisy," metric.
- Binned: The key action! All obtained average values aren't just lumped together. They are sorted into "bins"—predefined ranges.
For example, you could create three bins:
Bin 1: "Low Arousal" (pupil dilation less than 5%)
Bin 2: "Moderate Arousal" (dilation between 5-15%)
Bin 3: "High Arousal" (dilation greater than 15%)
As a result, instead of saying, "Participants showed an average pupil dilation of 8.7%," you say: "65% of the audience demonstrated moderate emotional arousal, and 20% showed high arousal."
Why This Is Brilliantly Simple and Incredibly Useful
- It Overcomes Individual Differences. Maria naturally has wider pupils than Sasha. Simply averaging their metrics would distort the result. Grouping by the degree of change (relative to their personal baseline) neutralizes this difference. You're not comparing absolute millimeters, but the intensity of the reaction.
- It Maps Your Audience. You see not an abstract number, but the distribution of your audience across engagement levels.
Good Scenario: Most of the audience is in Bins 2 and 3 (moderate and high arousal). The content resonated.
Concerning Scenario: 80% of the audience is in Bin 1 (low arousal). The content fails to elicit a response.
Polarizing Scenario: Equal distribution between Bin 1 and Bin 3. The content is either loved intensely or leaves viewers indifferent. This is a valuable insight for niche products! - It Makes Reports Compelling for Non-Specialists. Telling a client "p < 0.05" is an abstraction. Showing a slide that states: "One in five of your potential customers shows peak interest at the key moment of the video" is an argument that cannot be ignored.
A Practical Example: Testing Two Endings for a Commercial
- Ending A (Happy Family):
Low Arousal Bin: 10%
Medium Arousal Bin: 70%
High Arousal Bin: 20%
Conclusion: Evokes consistently warm, positive, but not peak emotions. A safe choice. - Ending B (Unexpected Twist with Humor):
Low Arousal Bin: 40%
Medium Arousal Bin: 30%
High Arousal Bin: 30%
Conclusion: Polarizes the audience. One third is delighted, one third doesn't get it and remains indifferent. A risky but potentially viral option.
The Bottom Line: Average Pupil Diameter Binned is not just a metric; it's a strategic segmentation tool. It answers not the question "How strong was the reaction?" but the question "What portion of my audience reacted, and how strongly?" It transforms pupil data from a diagnosis for a single patient into an epidemiological map for the entire population of your consumers.
Мы на RUTUBE: https://rutube.ru/channel/15929939/
Наш сайт: https://project12488975.tilda.ws/
Мы находимся на DZEN: https://dzen.ru/id/67e3fb0af580b555b1c37fbc