Найти тему

EEG analysis. DAFCAR-cartogram

Оглавление

The alpha rhythm dispersion cartogram according to S.V. Rosman is a clear visual representation of the results of the alpha rhythm dispersion analysis. The dispersion analysis is based on the method of determining the degree of increase in the functional entropy (measure of disorder) of the neural network of the human brain by mathematically processing the power spectrum of the EEG alpha rhythm. The method is suitable for diagnosing a wide range of mental disorders, starting from the early stages of their development.

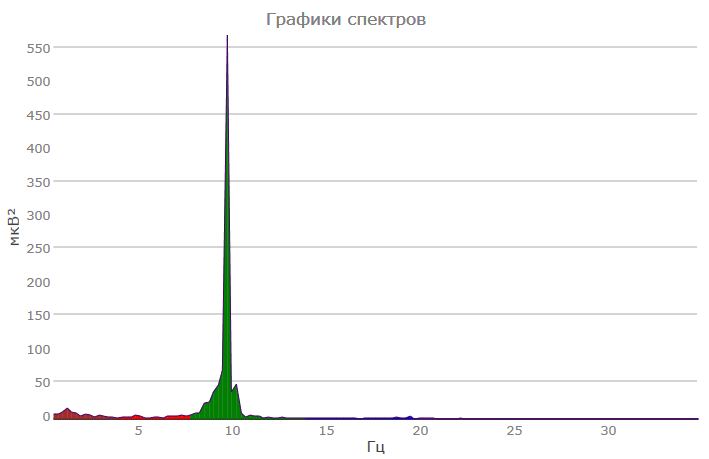
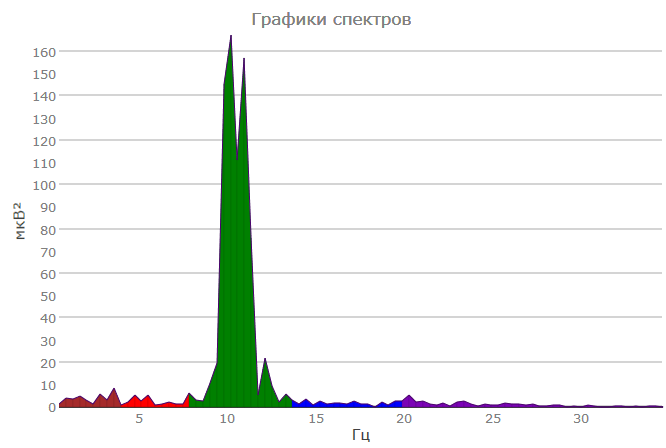
The essence of this approach is based on the fact that the normal alpha rhythm of an adult should be characterized not only by a certain frequency (9–12 Hz), but also by monomodality – a significant dominance of a certain frequency in this interval. Externally, on the power spectrum, this is manifested by the absence of splitting of the alpha range, the presence of a single peak. This parameter can be assessed qualitatively, distinguishing mono, bi- or polymodal types of the alpha rhythm power spectrum.

An example of a monomodal type of alpha rhythm spectrum
An example of a bimodal alpha rhythm spectrum
An example of a polymodal type of alpha rhythm power spectrum

As an alternative to visual analysis of spectrum power graphs, a tool called DAFCAR (Dispersion of Amplitude Frequency Characteristics of Alpha Rhythm) cartograms has recently been proposed, which show the distribution of spectrum power by frequency and lead on a two-dimensional plane using a color palette.

An example of a DAFCAR cartogram with a monomodal alpha-rhythm power spectrum. The cartograms are divided by hemispheres. The frontal-occipital gradient of the alpha rhythm is clearly visible. The alpha rhythm peaks in the occipital leads over both hemispheres are reflected in the cartogram as red dots. The left hemisphere is at the top, the right hemisphere is at the bottom.
An example of a DAFCAR cartogram with a bimodal alpha-rhythm power spectrum. The cartograms are divided by hemispheres. Two alpha-rhythm peaks are clearly visible over both hemispheres as red dots on the cartogram. The cartograms are symmetrical across the hemispheres.
An example of a DAFCAR cartogram with a polymodal type of alpha-rhythm power spectrum. The cartograms are divided by hemispheres. The wide dispersion of the alpha-rhythm is clearly visible, the fronto-occipital gradient is not uniform. The alpha-rhythm peaks with a clear shift to the left hemisphere are reflected in the form of red dots on the cartogram.

DAFCAR maps provide a visual representation of the alpha rhythm distribution by leads, symmetry and frequency dispersion.

For example, in a normal EEG of a healthy person, the DAFCAR map clearly shows a focused peak of the spectrum power at a frequency of about 10 Hz with a distinct fronto-occipital gradient without visible asymmetry by hemispheres.

DAFCAR-cards of a healthy person

The characteristic shift of the alpha rhythm peak, its dispersion, localization, asymmetry and disruption of the frontal-occipital gradient can be used to judge deviations in the functioning of the brain. For example, it has been noted that in schizophrenia, the alpha rhythm peak usually shifts to the region of lower frequencies and frontal leads.

It has been noted that in schizophrenia, the peak of the alpha rhythm usually shifts to the region of lower frequencies and frontal leads.

The following example shows a shift of the alpha rhythm to the low-frequency region, pronounced interhemispheric asymmetry and a spread of the spectrum power by frequency.

Shift of the alpha rhythm to the low-frequency region, pronounced interhemispheric asymmetry and spread of the spectrum power by frequency

An example of hypsarrhythmia on DAFCAR maps - multiple peaks at different frequencies on different derivations.

An example of hypsarrhythmia on DAFCAR maps - multiple peaks at different frequencies on different derivations.

An example of a clear splitting of the alpha rhythm peak, its shift to the slow-wave region with a violation of the frontal-occipital gradient and pronounced interhemispheric asymmetry.

An example of a clear splitting of the alpha rhythm peak, its shift to the slow-wave region with a violation of the frontal-occipital gradient and pronounced interhemispheric asymmetry.

Conclusion

DAFCAR cartograms are a simple and visual tool for analyzing alpha rhythm dispersion, allowing one to quickly assess the dominant frequency of the alpha rhythm, the number of peaks, the integrity of the fronto-occipital gradient, the symmetry of the spectrum power across the hemispheres, and the breadth of the spectrum power distribution (spectrum focus or blur).

Literary

  1. The Use of Analysis of Variance of the Alpha Rhythm of the EEG in the Study of the Pathogenesis of Alcoholism and the Causes of Alcoholic Deliria, Rosman S.V., 2017.