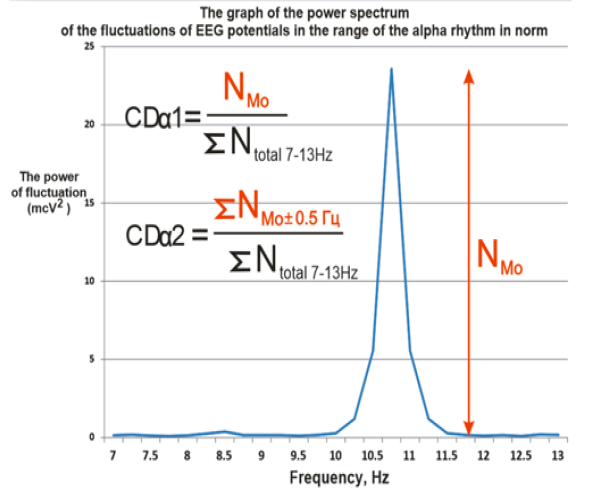
EEG dispersion analysis is calculated based on the results of spectral characteristics of the electrical activity of the brain. The essence of the method is to calculate dispersion coefficients within a given frequency range (for example, by rhythms) for each derivation. This coefficient shows the ratio of the maximum rhythm power to the total rhythm power in percent and characterizes the degree of expression of the dominant rhythm frequency.
The principle of calculating the dispersion of the alpha rhythm
The principle of calculating the alpha rhythm dispersion and its normal values are described in detail in the patent for invention RU 2506044C1:
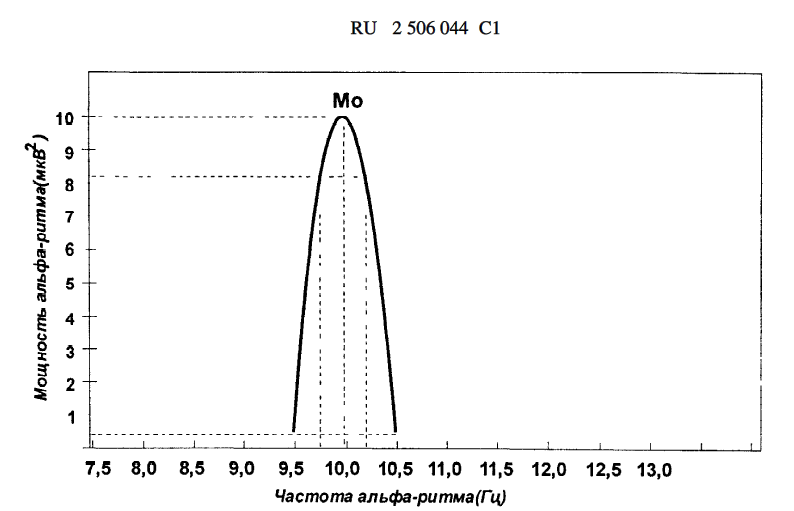
The dispersion coefficient K1 is calculated as the ratio of the maximum spectrum power (Mo on the graph is equal to 10 μV²) to the total area under its graph in the entire range of specified frequencies (for the alpha rhythm 8-14 Hz). Also for a more detailed analysis, the coefficient K2 is used, which is calculated as the ratio of the maximum spectrum power to the area under its graph in the range of ±0.5 Hz from Mo, as in the figure.
Example of variance calculation
Let's consider an example of calculating the alpha rhythm dispersion. The figure below shows a spectrum graph with a dominant alpha rhythm frequency of 9.8 Hz. The maximum power at this frequency was 388.8 μV². At the same time, the total spectrum power in the alpha range (calculated as the area under the spectrum graph in the alpha rhythm range) was 477.52 μV².
That is, the dispersion of the alpha rhythm will be calculated as the ratio of the maximum spectrum power in the alpha range to its total power: 388.8 / 477.52 = 81.4%.
In other words, dispersion characterizes the expression of the dominant frequency in relation to the spectrum power in the entire range. Here is an example of a pronounced peak in the alpha rhythm:
Here is an example of a less pronounced alpha rim peak:
For example, for the alpha rhythm, there are studies showing the dependence of the functional state of the brain on the level of its dispersion.
Thus, in the works of S. V. Rosman, norms of alpha rhythm dispersion are given for healthy people and for people with varying degrees of organic brain damage.
The calculation results are displayed in the form of tables or topographic maps by hemisphere.
EEG dispersion analysis is used in diagnostics of mental disorders of patients. In a healthy person, the spatial-frequency distribution is formed along the forehead-occipital axis with moderate dispersion towards deceleration and acceleration. In patients with psychotic disorders in schizophrenia, with somatoform disorders, with depression, with attention deficit hyperactivity disorder (ADHD) or simply with a reduced level of attention, there is a tendency for spatial-frequency deviation with frequency expansion towards deceleration, especially in the frontal areas, which is interpreted as a sign of functional hypofrontality.
In the case of anxious affect, the opposite picture is observed, there is excessive consolidation of the alpha rhythm relative to the forehead-occipital axis with a narrowing of the dispersion zone both in the direction of deceleration and in the direction of acceleration. Thus, the use of this method of dispersion analysis in non-epileptic electroencephalography allows for the highly effective diagnosis of mental disorders.
This technique is especially important for the contingent subject to severe psycho-emotional stress.
Application of Analysis of Variance
The practical application of dispersion analysis in electroencephalography is aimed primarily at analyzing the spatial-frequency distribution of the alpha rhythm along the convexity of the head. It is not widely used, but interest in it is growing, since a high level of dependence between the features of the spatial structure of the alpha rhythm and the clinical picture in nosological forms has been shown on a huge statistical material on a model of patients with mental illnesses. A certain dependence on the prevalence of individual personality traits has also been noted, for example, the prevalence of anxiety disorders or behavioral disinhibition within the framework of individual traits of conditionally healthy people.
If necessary, deviations in the EEG detected using this method can be corrected, for example, using biofeedback training.
The prospects for using the dispersion analysis method in non-epileptic electroencephalography allow us to expect high efficiency with a high degree of probability.
Literary
- The Use of Analysis of Variance of the Alpha Rhythm of the EEG in the Study of the Pathogenesis of Alcoholism and the Causes of Alcoholic Deliria, Rosman S.V., 2017.
- Depression in the Context of Search of a New Paradigm in Psychiatry, Rosman S.V. and Maximova N.E., 2018.
- The Role of Cardiology in Search of a Paradigm of Psychiatry, S.V. Rosman1 and L.V. Lebedeva, 2017.