Good afternoon!
Case problem 8.1. Estimate the hematocrit of a person with a plasma volume of 3 l and total blood volume of 4.5 l.
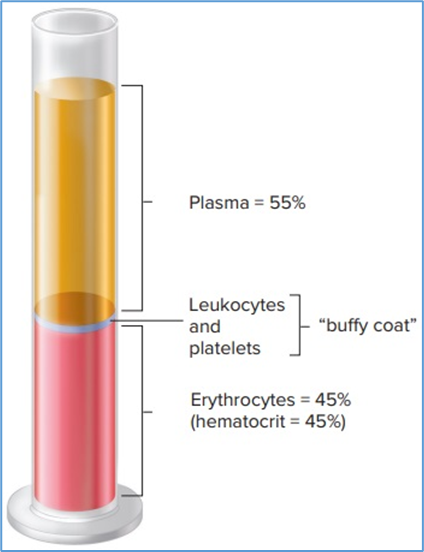
Hint for answer 8.1. The hematocrit would be 33% because the red blood cell volume is the difference between total blood volume and plasma volume (4.5 − 3.0 = 1.5 L), and hematocrit is determined by the fraction of whole blood that is red blood cells (1.5 L/4.5 L = 0.33, or 33%).
Case problem 8.2. Predict how the blood flow to these various areas might change in a resting person just after eating a large meal.
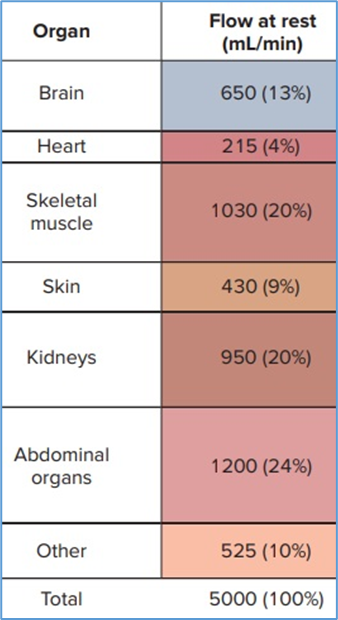
Hint for answer 8.2. The major change in blood flow would be an increase to certain abdominal organs, notably the stomach and small intestines. This change would provide the additional oxygen and nutrients required to meet the increased metabolic demands of digestion and absorption of the breakdown products of food. Blood flow to the brain and other organs would not be expected to change significantly, but there might be a small increase in blood flow to the skeletal muscles associated with chewing and swallowing. Consequently, the total blood flow in a resting person during and following a meal would be expected to increase.
Case problem 8.3. If outlet B in Figure 12.8b had two individual outlet tubes, each with a radius of 1, would the flow be equal to side A? (Hint: Remember the formulas for the circumference and area of a circle.)
Hint for answer 8.3. The flow on side B would be doubled, but still less than that on side A. The summed wall area would be the same in both sides. The formula for circumference of a circle is 2πr; so, the wall circumference in side A would be 2 × 3.14 × 2 = 12.56; for the two tubes on side B, it would be (2 × 3.14 × 1) + (2 × 3.14 × 1) = 12.56. However, the total cross section through which flow occurs would be larger in side A than in side B. The formula for cross-sectional area of a circle is πr 2, so the area of side A would be 3.14 × 22 = 12.56, whereas the summed area of the tubes in side B would be (3.14 × 12) + (3.14 × 12) = 6.28. Thus, even with two outflow tubes on side B, there would be more flow through side A.
Case problem 8.4. During the plateau of an action potential, the current due to outward K+ movement is nearly equal to the current due to inward Ca2+ movement. Despite this, the membrane permeability to Ca2+ is much greater. How can the currents be similar despite the permeability difference?
Hint for answer 8.4. The rate of ion flux across a membrane depends on both the permeability of the membrane to the ion, and the electrochemical gradient for the ion. During the plateau of the cardiac action potential, the membrane potential is positive and closer to the Ca2+ equilibrium potential (which also has a positive value) than it is to the K+ equilibrium potential (which has a negative value). Thus, Ca2+ has a high permeability and a low electrochemical driving force, while K+ has a lower permeability but a higher electrochemical driving force. These factors offset each other, and the oppositely directed currents end up being nearly the same.
Case problem 8.5. Conducting Purkinje cells of the ventricles contain all of the ion channel types found in both cardiac muscle cells and node cells. Draw a graph of membrane potential versus time showing a Purkinje cell action potential.
Hint for answer 8.5. Purkinje cell action potentials have a depolarizing pacemaker potential, like node cells (though the slope is much more gradual), and a rapid upstroke and broad plateau, like cardiac muscle cells.
Case problem 8.6. How would the timing of the waves in (a) be changed by a drug that reduces the L-type Ca2+ current in AV node cells?
Hint for answer 8.6. Reducing the L-type Ca2+ current in AV node cells would decrease the rate at which action potentials are conducted between the atria and ventricles. On the ECG tracing, this would be indicated by a longer interval between the P wave (atrial depolarization) and the QRS wave (ventricular depolarization).
Case problem 8.7. Some people have a potentially lethal defect of ventricular muscle, in which the current through voltage-gated K+ channels responsible for repolarisation is delayed and reduced. How could this defect be detected on their ECG recordings?
Hint for answer 8.7. A reduction in current through voltage-gated K+ channels delay the repolarization of ventricular muscle cell action potentials. Thus, the T wave (ventricular repolarization) of the ECG wave is delayed relative to the QRS waves (ventricular depolarization). This fact gives the name to the condition “long QT syndrome.”
Case problem 8.8. If a person had a hole in the interventricular septum, would the blood ejected into the aorta have lower than normal oxygen levels?
Hint for answer 8.8. Aortic blood would not have significantly lower-than-normal oxygen levels. The pressure in the left ventricle is higher than the right throughout the entire cardiac cycle. This pressure gradient would favor blood flow through the hole in the septum from the left ventricle into the right. Therefore, pulmonary artery blood would be higher in oxygen than normal (because blood in the left ventricle has just come from the lungs), but deoxygenated blood would not dilute the blood flowing into the aorta.
Case problem 8.9. What valve defect(s) would be indicated by the following sequence of heart sounds: lub-whistle-dup-gurgle?
Hint for answer 8.9. The patient most likely has a damaged semilunar valve that is stenotic and insufficient. A “whistling” murmur generally results from blood moving forward through a stenotic valve, whereas a lower-pitched “gurgling” murmur occurs when blood leaks backward through a valve that does not close properly. Systole and ejection occur between the two normal heart sounds, whereas diastole and filling occur after the second heart sound. Thus, a whistle between the heart sounds indicates a stenotic semilunar valve, and the gurgle following the second heart sound would arise from an insufficient semilunar valve. It is most likely that a single valve is both stenotic and insufficient in this case. Diagnosis could be confirmed by determining where on the chest wall the sounds were loudest and by diagnostic imaging techniques.
Case problem 8.10. Parasympathetic stimulation also increases the delay between atrial and ventricular contractions. What is the ionic mechanism?
Hint for answer 8.10. The delay between atrial and ventricular contractions is caused by slow propagation of the action potential through the AV node, which is a result of the relatively slow rate that the cells are depolarized by the L-type Ca2+ current. Parasympathetic stimulation slows AV node cell propagation further by reducing the current through L-type Ca2+ channels, which in turn increases the AV nodal delay.
Case problem 8.11. Estimate the ejection fraction and end-systolic volumes under control and under sympathetic-stimulated conditions at an end-diastolic volume of 140 ml.
Hint for answer 8.11. Ejection fraction (EF) = Stroke volume (SV)/End-diastolic volume (EDV); End-systolic volume (ESV) = EDV − SV. Based on the graph, under control conditions, the SV is 75 mL and during sympathetic stimulation it is 110 ml. Thus: Control ESV = 140 − 75 = 65 mL, and EF = 75/140 = 53.6%; Sympathetic ESV = 140 − 110 = 30 mL, and EF = 110/140 = 78.6%.
Case problem 8.12. At an increased heart rate, the amount of time spent in diastole is reduced more than the amount of time spent in systole. How would you estimate the mean arterial blood pressure (from systolic and diastolic pressures) at a heart rate in which the times spent in systole and diastole are roughly equal?
Hint for answer 8.12. At resting heart rate, the time spent in diastole is twice as long as that spent in systole (i.e., 1-3 of the total cycle is spent near systolic pressures) and the mean pressure is approximately 1-3 of the distance from diastolic pressure to systolic pressure. At a heart rate in which equal time is spent in systole and diastole, the mean arterial blood pressure would be approximately halfway between those two pressures.
Case problem 8.13. An experiment is performed in which the blood flow through a single arteriole is measured. Initially, arterial pressure and flow through the arteriole are constant, but then the arterial pressure is experimentally increased and maintained at a higher level. How will blood flow through the arteriole change in the minutes that follow the increase in arterial pressure?
Hint for answer 8.13. When the arterial pressure is increased, the blood flow through the arteriole will initially increase because the ΔP is higher but the resistance is unchanged (or the resistance might even be lower if the increased pressure stretches it). Within the next few minutes, however, the local oxygen concentration will increase and local metabolite concentrations will decrease, inducing vasoconstriction of the arteriole. This increases resistance, and blood flow will thus decrease toward the level it was prior to the increase in arterial pressure.
Good luck in your studies!