Graphic Organizers
Visual students build their understanding of content through visual organizers, and these are easy to create on computers. Examples of graphic organizers can be found in any internet search. In addition to the common spiderweb graphic, students can try cause-and-effect charts, story maps, bubble maps, t-charts, and compare-contrast graphs.
Some teachers use commercial graphic organizer software, although students can use shapes in any presentation software or word processor to create graphic organizers. Often blank slides work better for design than word processors.
Students can also use an online graphic organizer for creating mind maps and brainstorming. The advantage of student-designed graphic organizers over predesigned ones is that students can better represent their thinking when they control the design. In fact, one goal of using graphic organizers is to stimulate students to independently design visual diagrams as thinking tools.
Popplet (popplet.com) was created for ages 13 and under and is available online or for the iPad. To register online, students must have email accounts, but they do not give unnecessary information and they choose their own passwords. The interface is easy to master.
ReadWriteThink also has several graphic organizer tools. The Webbing Tool (rwtinteractives.ncte.org/view_interactive.aspx?id=127) can make cluster, cause-and-effect, and hierarchy webs. Typically, tools from ReadWriteThink are student-friendly and can be printed or saved. Lessons plans for using the ReadWriteThink Webbing Tool span Grades 3–12.
Although students can use graphic organizers as a planning step for projects, mind maps or webs can also become the final products for a learning cycle. In one third-grade classroom, students in study groups researched immigration from different countries. The teacher ended the study by using the jigsaw method to make expert teams with one child from each study group. The expert teams then created diagrams to compare and contrast the immigrants from the countries they’d studied. The conversations students had as they designed their diagrams surpassed any whole-group discussions during the unit, and the teacher never could have settled on only one design that would have honored the divergent thinking within her class.
Flow Charts
Introduce students to engineering by teaching them to create decision-making flow charts. These graphic organizers give students practice with analysis, which is at the fourth of six levels of Bloom’s taxonomy. Using Shapes in any productivity suite such as Microsoft
Office, OpenOffice, or Google Docs, students can design flow charts. Online webbing tools also have flow chart capabilities.
Big questions are used as titles. Smaller questions are written on diamond shapes, and possible answers on individual squares or rectangles. Arrows connect the diamonds and squares. Answers may consist of yes/no or may be specific to the situation. If there are conditions that influence the decision, the conditions can be written on the arrowed lines. An answer may easily lead to a second question, which has several possible answers. Sample big questions for flow charts include the following:
• What are the steps for solving a math word problem?
• How can you tell living from nonliving things?
• How do you know whether you can use an image in a slideshow that will be made
public?
• How do you troubleshoot a computer problem?
• What are the implications of a decision (on any topic)?
• How do you choose an independent reading book?
• How do you respond to a bully?
Flowcharts can also be made with free digital tools. With Gliffy (gliffy.com), students can make flowcharts, graphic organizers, and other technical drawings for free. Students over age 13 can create an account first and then request a free single user license. Otherwise the site requires a paid subscription. NCH Software offers free, downloadable ClickCharts diagram and flowchart software (nchsoftware.com/chart).
Decision trees can be made for free on Canva (canva.com/graphs/decision-trees) using one of their templates. Although the online tool is free, registration is required. Teachers and parents are permitted to allow students on the site provided the students are directly supervised by the adult. Canva’s decision trees can include photos.
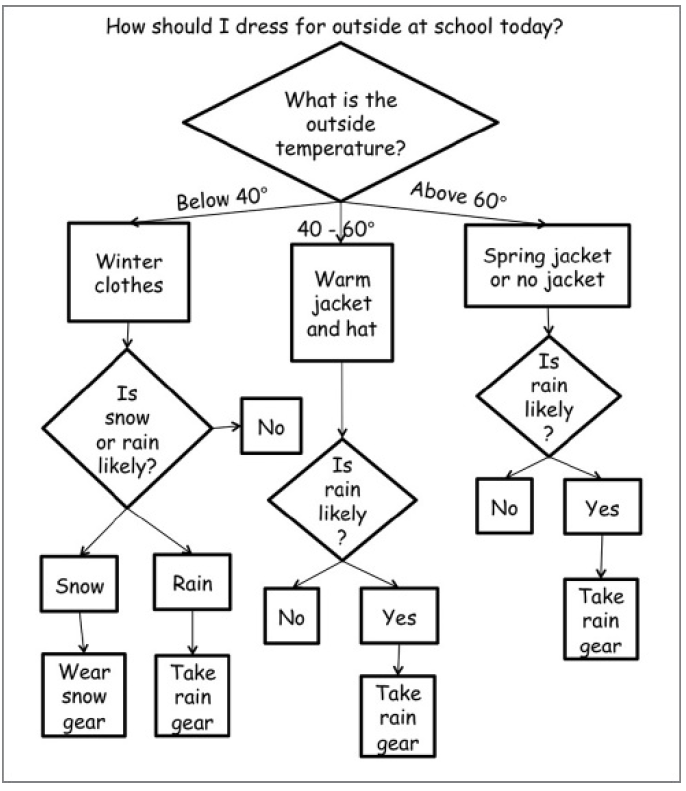
Figure 5.4. Decision Flowchart.
Timelines
Students can use timelines to track the sequence of events in books or historic events. On other occasions, teachers may want students to make connections among events that seem disparate. Timelines can help. For instance, students in one class were reading biographies of famous people; they used a class timeline to look for overlaps of their subjects’ life spans.
Students in another class used timelines to plot the events of the colonization of America. To dramatize an event, students can combine dates, photos, audio, and video clips in a slideshow. To view a professional example, see The Sesame Street Timeline (youtube.com/watch?v=Cz4JPszHnZM).
Commercial timeline software never seemed worth the price at my school because teachers simply did not create enough timelines for the software to pay for itself. Online timeline generators suitable for elementary students, however, have limitations that make them less attractive than commercial software. The really good, free, online timeline generators restrict users to individuals over the age of 13.
Secondary students have many choices of good timeline generators. Consider having students create timelines in word processor tables, spreadsheets, or presentation software. In the following list of resources, free timeline websites come first, followed by online help for creating timelines.
The National Council of Teachers of English provides a number of online interactive tools for students at ReadWriteThink. The Timeline interactive (readwritethink.org/files/resources/interactives/timeline_2) is particularly easy to use with students who have limited technology skills. Two features limit the tool: Students can use words but not pictures in their timelines, and the timelines cannot be saved, so they have to be finished in one sitting. Students can print their timelines horizontally or vertically.
Teach-nology (teach-nology.com/web_tools/materials/timelines) provides two simple timeline tools: a vertical timeline that shows up to nine events and a horizontal timeline that shows up to six events. This tool has the same limitations as those developed by ReadWriteThink.
Microsoft Office has acquired a free online timeline maker called Pincello (pincello.officetimeline.com), which allows users to build timelines from scratch or from Excel data. Timelines can be downloaded to PowerPoint or as an image. No logon seems to be required to create or download, although saving may require an account. Microsoft also offers an Excel Timeline Template (templates.office.com/en-us/Timelines).
Preceden for Teachers (preceden.com/teachers) has free teacher accounts, but this is one of the rare occasions when I advocate paying the $29 annual subscription fee if students will be making multiple timelines. With subscriptions, teachers can create student accounts, have unlimited numbers of timelines with unlimited entries and photos, and save student work.
The step-by-step instructions on how to use the entirely web-based site are excellent; all you need is access to the internet. You can even layer multiple timelines so that students can see how the events and dates on their timelines intersect with other timelines. Of all the timeline software options, this one provides the greatest flexibility.
MyHistro (myhistro.com) is for students over age 13. MyHistro timelines integrate text, video, and pictures with maps to create digital stories. Students can collaborate on the timelines as well.
Graphs and Charts
Teachers are not as likely to have experience with spreadsheets as with other productivity software, but spreadsheets are not difficult to master. For beginner graphing experiences, classes often use colored candies or cereal. Students sort their small containers of bits by color and enter the data in a table. The table can then be converted to a graph. The exercise itself has little need for a graph because students generally can tell from looking at the data table which color is more plentiful. To extend the activity, ask students to predict what the results will be if they combine all the data into one graph. Which colors will predominate?
Which will be less common? Then collate and graph all the students’ data. How did the greater total number of objects affect the graph results? If a teacher combines data from another class to increase the total number again, students can predict the final outcome and then test their hypotheses. In collaborative spreadsheets, such as Google Docs, students can simultaneously enter their data individually onto separate columns. The rows of the data table can then be added and the data totals graphed.
At the secondary level, students can conduct surveys or collect data from science experiments. Middle- and high-school students should be able to use digital spreadsheets, although they may have limited experience with graphing.
Of critical importance for teaching graphing skills is the conversation about what the information shown by graphs means. Weather data provide excellent opportunities to examine differences among cities and countries. In one class, students used a spreadsheet template with the local average monthly temperatures already entered. Each student visited Weatherbase (weatherbase.com) to collect data on a city in another country and created line graphs that compared data from their own city to data from the other city. Students set the yaxis range of their graphs to span the coldest and hottest temperatures in the class so all graphs used the same range and could be compared. The best learning took place when students compared all the graphs. Temperature patterns revealed the global positions of the cities and the surprising fact that equatorial cities, which maintained consistent temperatures year-round, were colder than cities outside the equator during some months. Data about precipitation helped students predict habitats in various parts of the world.
A fifth-grade teacher, aware of her students’ fears about the transition to middle school, asked them to create a survey for middle-school students, conduct the surveys, collect data, and graph the responses. When they saw that sixth graders had not been shut in their lockers and, in fact, liked middle school, the fifth graders’ fears were allayed.
Students may generate other topics for which they create and administer surveys. For elementary students, surveys typically must be printed because online survey sites do not permit students under age 13 to generate or respond to questionnaires at their sites.
Secondary students have access to online survey applications, such as SurveyMonkey (surveymonkey.com) and Zoho Survey (zoho.com/survey). The advantage of an online survey is its time-saving feature that tabulates results automatically. Teachers and students can concentrate on discussing what the results mean.
Several online tools can be used for graphing data as a whole class or for generating graphs for students’ projects. The following tools are worth exploring.
Create a Graph (nces.ed.gov/nceskids/createagraph) is a government site where data can be entered and represented in different graph forms. The website also offers graphing examples based on government data and a tutorial on how to create a graph.
Using Chartle (chartle.net), students can make simple graphs and charts, interactive charts, and unusual graphic representations of data online. No registration is required.
ChartGo (chartgo.com), a graph maker tool, does not require registration. Data can be uploaded from Excel or as a .csv file. Students set the parameters and choose chart or graph types. The charts and graphs can be embedded on a blog or wiki, or downloaded to a computer.
DIYcharts (diycharts.com) is a new free charts and graphs tool that can be used without registration. The site offers 11 chart types and data can be typed live or imported from Excel.
Graphing Calculators
Secondary math teachers sometimes use digital tools for graphing functions. If your students cannot afford graphing calculators, free online tools can fill the gap.
GraphFree (graphfree.com) does not require registration and claims its capabilities exceed those of some graphing calculators. Teachers can also print blank graph paper on the site.
GeoGebra (geogebra.org) has a number of math apps and classroom resources. In addition to a graphing calculator, there are tools for geometry, 3D graphing, and augmented reality (for iPad and iPhone). The tools can be used online or downloaded for offline use.
Desmos (desmos.com/calculator) has a graphing calculator that students can use without signing in, but the better choice may be for teachers to create accounts in Desmos Classroom Activities (teacher.desmos.com). On the site are bundles of lessons using Desmos tools for different types of math explorations. Desmos can be used by students under age 13 with teacher accounts.
Sketchometry (sketchometry.org/en/index.html) converts hand drawings into geometric constructions. The app works on all platforms and interactively online. The tool is still under development.
Maps
Scribble Maps (scribblemaps.com) combines Google Maps images with the tools to scribble, draw, add text, insert place markers, and embed pictures on the map. The site is restricted to individuals who are at least 13 and have parental permission or are 18. In elementary classrooms where teachers could register, students could, as a whole-class activity, track Flat Stanley (flatstanleyproject.com) or other literacy and traveling projects, identify the locations of Skype partners, or follow the Iditarod trail. Individual students might re-create the journey of an historic figure, locate U.S. presidents’ birthplaces, or identify landmarks in a country under study. Marked maps can be saved as images.
Another mapping tool, provided by National Geographic, is MapMaker Interactive (mapmaker.nationalgeographic.org). World and national maps can be marked to trace a journey, as in the books Letters from Rifka by Karen Hesse or Around the World in 80 Days by Jules Verne. Maps can be saved as editable files, so that the class members can continue to refine their maps as they progress through the books. In history classes, students can map migration paths or explorers’ trails.
Cartoons
Creating cartoons causes students to narrow an event to its essential parts, which requires high levels of thinking. Good cartoons tell as much through pictures or drawings as through the words. One fourth-grade teacher has her students use clip art, photos, and shapes in slideshow software to create their own comics. Resources to demonstrate how to use slides for comics can be found in the Google Apps User Group discussion board under “Creating Comic Strips with Google Slides” (controlaltachieve.com/p/session-comic-strips.html).
Cartoons need not be funny; often comics carry weighty messages using irony or satire.
Students can use comics to express viewpoints, explain concepts, review books, tell (or retell) stories, present facts, outline processes, or sequence events. Cartoons can be integrated into science or any other content area through explicit teaching about puns and other wordplay. “Humorous Cartoons Made by Preservice Teachers for Teaching Science Concepts to Elementary Students: Process and Product,” an article by Rule, Sallis, and Donaldson (2008. scholarworks.uni.edu/oermaterials), includes an appendix with 24 slides of humorous science comics made by preservice teachers. There are two comics per slide with the science explanation beneath each slide. The article is free and appropriate for teachers to review to spur creative thinking about what students could do on other topics. This may be one time when clip art is an effective medium for conveying a message.
MakeBeliefsComix (makebeliefscomix.com) is free and geared toward children. A limited cast of multicultural characters and palette make this an easy-to-master tool. (Users need a Flash Player 10 or above.) The printables and lesson plans on this site are incredibly helpful for elementary teachers. Finished cartoons can be printed or emailed, but not saved. Students may write talk balloons in English, Spanish, French, German, Italian, Portuguese, or Latin.
The site has a Special Needs section with ideas and tips from those who work with special needs students.
Write Comics (writecomics.com) is a simple online comic strip creation tool. Character choices are limited and include few people of color.
ToonDoo (toondoo.com) requires registration but is free. Students under age 13 are not permitted to register.
Toony Tool (toonytool.com) provides a limited palette of backgrounds, characters, dialog bubbles, props, and text boxes for creating one-panel cartoons. Users can also upload their own images. The finished products can be printed, emailed, downloaded, or shared online.
The tool is free, does not require registration, and so is suitable for all students. Toony Tool would serve as a simple introduction for younger students and a great base for political cartoons at the secondary level. The site hosts other tools, such as word clouds, photo collages, and a photo enlarger, to name just a few. It is worth exploring the entire site because the tools are intuitive and don’t require registration.
Comics Head (comicshead.com) is a free iPad app. The tool provides templates, animation, and many options in the resource area. The site does not list age restrictions.
Storyboard That (storyboardthat.com/storyboard-creator) requires a subscription after a 14- day free trial, but its education edition offers a lot of teacher support as well as good options for students. Teachers can choose to pay for only one month, provided they remember to cancel before the month is up, so it is possible to do one good project at a reasonable cost.
Although Storyboard That is listed here as a tool for cartooning, like many digital tools in this book, it can be used for many purposes. Dr. Brent Hollers described how his students took advantage of the potential in Storyboard That for a different kind of visual representation.
Graphic Novels or Short Stories
Increasingly, teachers are becoming aware of how graphic novels intrigue visual learners as reading materials. Graphic novels also benefit students who are learning English because the pictures carry so much of the storyline. Consider the level of inference students must use to “read” the pictures in a graphic novel!
Graphic novels can be engaging and challenging for students to write as well. For students who struggle with words, graphic novels can help them express their own complex ideas, including various characters’ emotions, motivations, and shades of meaning, that these students are not equipped to express using words alone.
I use the words graphic novels loosely when discussing student products. A true graphic novel would require more time and expertise than could be expected at the elementary or even secondary level among most students. Instead of full-length novels, students can produce short graphic stories, like simple comic books, that tell fictional stories, retell stories they’ve read, or review historical events.
As with cartooning, students need a plan prior to commencing their graphic stories, but unlike cartooning, creating graphic stories requires entire storylines. Ideally, students use storyboards to plan their ideas for graphic novels, so they can review their stories with peers to identify any aspects that may be missing or confusing. Illustrations can be hand drawn or computer based. Depending on prior experiences, students could stage props to photograph for their novels.
Advanced students might combine photographic backgrounds with clip art and hand drawing in a drawing program. Fourth- and fifth-grade students at my previous school often pasted background photos and clip art into a drawing program; then they used the drawing tools to add details. They would save the mashed-up pictures and import them into presentation slides. In the slides, they used shapes to make speech bubbles and added text. This was not something teachers taught—students discovered how to adapt the drawing program themselves and taught one another. Secondary students could easily replicate this.
Graphic novels or short stories can be produced in several venues mentioned throughout this book: slideshows, digital storytelling apps, online book creation sites, or word processing programs. Use the tools that are comfortable for your students. Ideas for graphic books or stories should not be limited to fiction. Think about graphic nonfiction articles that explain concepts in content areas or make local history accessible to younger students. These could be bound (or converted to ebooks) to be part of the school library’s collection.
Animations
Although most teachers will consider animations too difficult for whole-class instruction and exploration, I’ve included this topic for those who love to challenge themselves with technology. Animation can be exceedingly engaging and fun. Improvements in technology have provided more intuitive tools than in the past. Some online tools and apps blend storymaking, videos, and animations on their sites. I limited the list to easier formats. Explore the simple sites first and then do an online search for more advanced versions.
Children are fascinated with the potential of animations, but the task of making effective animations requires patience and knowledge of how animations work. Some free programming software packages, such as Squeak and Scratch, can be used to program animations, but few teachers have the skills, or the interest in building the skills, or the time to teach programming code successfully. Instead, I suggest that teachers direct students to online animation sites, which provide the tools to play drawings at high speed to simulate changes. When drawing images for animation, students learn that changes happen slowly over several frames. Before trying animation sites, students need to know the four ways images can change:
Size. An image can be made progressively larger or smaller.
Shape. The shape of an image can be progressively altered until it becomes something else.
Position. The location of an image can be changed to create the illusion of movement.
Addition/subtraction. On each page, adding or subtracting part of an image creates the illusion that an invisible hand is drawing or erasing the image.
Students need several opportunities to try out animation tools before they begin to master the skills. Their first experiences will probably result in poorly executed animations, but they will learn through their failures. The technical and art aspects of animation require a lot of cognitive skill, so before they begin, students should have a simple plan for their projects in mind, perhaps including a storyboard. They could illustrate a (very!) short story, simulate a chemical reaction, or show an electrical current lighting a bulb. Consider demonstrating the water cycle or life cycle of a plant or how simple machines work. The animation tools students use will determine the complexity of their animations.
The resources available for student-generated animations range from sites where students direct the animation but do not need to understand the technical aspects to tools where students do all the work of creating the sense of motion. At first, students need to explore a few tools to learn how they work.
Many animators started with flipbooks. The New York Film Academy has an article about various types of flipbooks that are possible (tiny.cc/0eyawy). Several animators have also made YouTube videos of their flipbook practices. This may be a good starting point for understanding flipbooks and how they contribute to computerized animations.
Flipbook (benettonplay.com/toys/flipbookdeluxe) has simple, intuitive drawing tools but it does require Flash, which limits its use in classrooms. Students need to know that they are creating each slide of the animation. Since the slides flip quickly, changing something in every slide actually makes the animation jumpy, rather than smooth. Students should insert two or three identical slides before they make any slight change to the next slide. This simple rule will improve the animations significantly. Guests are allowed to create flipbooks of up to 100 frames without registering; flipbooks made by registered users are shown in a gallery on the site.
ABCya! Make an Animation (abcya.com/animate.htm) provides drawing tools and colorful clip art for animations using Flash. Students can upload their own pictures for the background, adjust the frame rate, and make up to 100 frames. ABCya! is a great site for teaching students the fine art of animation. The tutorial on the site introduces the tools and potential of animation. Creating animations represents Bloom’s taxonomy at its highest level.
PowToon (powtoon.com/edu-home) has an educator site that allows secondary students and teachers to create accounts. Many of the services are free, although the final products are watermarked and download as PDF or PPT. Student and teacher accounts are available at an annual cost. With a teacher subscription, this site could be used with elementary students.
Take a look at the Tutorials page to see what the site offers for your students.
Flip Anim (flipanim.com) does not list age restrictions on its site, and students can make flipbooks without registering. But in order to save or publish, students need to register for the site with an email address. When flipbooks are saved and made public, creators must indicate if the animation is for viewers over age 18.
Augmented Reality
The use of augmented reality is making headway into schools and classrooms. Augmented reality, known as AR, is the use of technology to enhance what you see in reality. This differs from virtual reality (VR), which is the projection of a computer-generated environment where a viewer is immersed in and interacts with the environment.
AR experiences require the use of smartphone cameras or tablets with cameras, such as iPads. Secondary students are more likely than elementary children to have the smartphones in their pockets. Teachers with iPads will be able to participate in AR experiences. If a teacher has only one or two iPads available, consider making the use of AR a center in the classroom or presenting the AR experience to the whole class through a document camera and projector.
Augmented reality is when technology is used to superimpose information on the real world. The information may be text, images, sounds, or video. Pokemon Go! is an example of AR, as is SkyView Free (play.google.com/store/apps/details?id=com.t11.skyviewfree), a stargazing app that uses your phone camera to locate and identify objects in the sky. When televised sports use colored lines to mark the line of scrimmage or arc of a soccer ball or hockey puck, viewers are seeing AR in action.
For the purposes of this book, the discussion will be limited to marker-based AR, even though other types are being developed. Marker-based AR requires a special visual object, such as a QR code or special signs, and a camera to scan the visual object. Often the markers will be downloaded and printed, but some markers are on -screen. When a smartphone or table camera is pointed at the marker, the viewer will see an augmented object, such as a 3D model of the Eiffel Tower or a rhombus; text, like descriptions of a country’s topography; or a video, such as a book trailer. Teachers can provide AR experiences for students or can involve students in creating their own AR objects.
AR Sites
In her Voices of Experience write-up, teacher Lula Garcia identified several AR apps she uses with students. I’ve listed a few additional apps, and I recommend you visit EdShelf (edshelf.com) and search for augmented reality. You’ll find teachers’ shelves of AR apps they like.
Blippar (web.blippar.com/augmented-reality-for-education) is an AR creation tool as well an as an AR resource. Free basic accounts have limited features. Educational pricing is available but not evident on the site.
Arloon (arloon.com/en) has created three elementary (Mental Math, Plants, and Solar System) and three secondary (Geometry, Anatomy, and Chemistry) AR apps to be projected onto free Augmented Reality Cards printed from their website. The apps are available through iTunes and Google Play. Each app costs about $3.
Shakespeare’s Globe 360 (shakespearesglobe.com/discovery-space/globe-360), an iOS app, provides a 3D experience with the Globe Theater. The experience includes video and photo galleries from Globe Theater productions.
Virtual Reality
Virtual reality (VR) is considered by many to be the next great advancement in education. Others consider it still too expensive and experimental to provide much beyond the “Wow!” experience. Unlike AR, most current uses of VR will be dependent on budget windfalls and cooperative IT staff to assist a teacher with implementation. Internet searches on the pros and cons of VR will highlight both the benefits for students and the cautions teachers must consider. The Tech Edvocate published “20 Top Virtual Reality Apps That Are Changing Education” (tiny.cc/0kyawy), which may be a good starting place for your exploration of VR.
Instructing with Visuals
Teachers can use visuals for instructional purposes as well. For instance, when students are prereaders, photos can reinforce expectations, such as how the room should look at the end of the day, the procedures for borrowing a book from the classroom library, where things belong in the classroom, the equipment that goes into each bin, and other managerial tasks.
Teachers can also reinforce appropriate behavior by snapping photos of students doing things well—as long as the photos capture different students and, eventually, all students. Younger students may need picture reminders of important people in the school, including janitors, playground supervisors, and bus drivers.
Photos also provide visual ways for bilingual children to “see” concepts under study as they are building academic language. For instance, teachers can take photos of a bread slice in stages of decomposition to demonstrate “change over time.” Showing the photos illustrates the concept in a memorable way. Develop an eye for photo opportunities that illustrate curricular concepts, and keep your camera handy.
Documentation panels serve as another excellent instructional use for digital cameras. Documentation panels can be made at any grade level by students, as teacher-student collaborations, or by the teacher alone. The purpose of the panels is to illustrate various facets of the students’ learning in process. The photos show students as they are engaged in learning activities, including progressive steps of creating artifacts, such as writings, drawings, diagrams, charts, slideshows, videos, and 3D objects.
Photographs and objects are arranged in sequence on a panel, such as a science fair trifold, a bulletin board, or poster board, so viewers can see at a glance how students went about acquiring knowledge related to a learning goal. The learning goal should be stated at the top and the sequence of photos and artifacts numbered. Picture captions and/or quotations from students throughout their learning finish off the panel.
When posted, panels should be self-explanatory. Teachers can use them to communicate to parents, administrators, and visitors how learning happens in the classroom. Students can make documentation panels of how-to sequences or the stages of an experiment. Whatever the topic, documentation panels make the learning process visible.
Increasing visual input in classrooms also refers to using visuals as teaching tools during instruction. For first-grade teacher Diane Vyhnalek, the addition of a document camera to her classroom enhanced her opportunities to use visual materials while she was instructing.
Much of what she shared about her document camera use could be used in any classroom for more complex tasks and content.
Classroom instruction often favors auditory learners, but technology tools can increase the presence of visual instructional materials available for instruction. Consider how visuals enhance the following examples of whole-class and small-group instructional targets.
Develop Background Knowledge
The use of pictures can make content come alive for students who lack background knowledge about a subject. For example, to introduce a novel set in Venice, one teacher used Google Earth and online photographs. Students were then better able to comprehend the novel’s context because they could visualize it. A first-grade teacher toggled among an actual dragonfly carcass on the document camera, a website with photos of dragonflies, and a video clip to introduce a unit on insects. Science teachers can access a wealth of visual materials about the natural world through Arkive (arkive.org), including photographs and videos of wild animals. By incorporating web resources and real objects to introduce units, teachers can give all students simultaneous visual, auditory, and tactile experiences before units begin.
Model an Activity or Skill
Students have more success with new processes when teachers model the skills. Diane Vyhnalek not only modeled how to write the month on lined paper, but also invited students to compare their writing to hers. Because she used the same paper as they did, students could set their work next to the teacher’s for comparison. Interactive writing, problem-solving strategies, graphing, steps of a science experiment, and “reading” a historical photograph are all more easily understood if students can see visual modeling.
Read
While it’s common for primary teachers to show students books as they read aloud, teachers at other grade levels should consider how adding visual components could supplement students’ comprehension of texts. The visuals might be the illustrations from a text being read aloud, but it also could be showing students the conventions of nonfiction texts, reading story problems to identify critical information, or analyzing graphic images or complex mathematical equations. Test-taking skills are more memorable when students can read sample instructions or test questions to analyze what they are expected to do. By using a site like Docs Teach (docsteach.org), secondary social studies teachers can help students learn to read and annotate historical documents. Tapping into videos as visuals can hook students into language arts or content area texts.
Demonstrate
Science teachers, in particular, despair of having every child see a demonstration of a lab procedure when students crowd around their teachers. When document cameras are used, students stay seated, and the teacher projects the steps of the experiment for all to see. One teacher conducted the experiment in advance of class, captured each step with the document camera’s photography interface, and placed the photos in a slideshow. During the experiment, student teams completed each step simultaneously, and the teacher projected the slides to demonstrate what they should see. Equipped with a wireless mouse and a laser pointer, the teacher circulated among the teams, advanced the slides, and used the laser to highlight particular sections of photographs.
Solve a Problem
Although we may think of problems primarily in terms of math, consider the variety of problems students may encounter during school days. A counselor showed students video clips and photographs of conflicts at school, then invited the students to discuss how they could solve the problems. A writing teacher showed the class a student’s well-written paper and asked the students to suggest where the writer could expand the text with additional examples. Classmates came up with three places where the writer could add text.
Explore
Numerous websites lend themselves to whole-group exploration, discovery, and engagement:
Consider a series of video clips from NASA; a preliminary visit to a virtual manipulatives site, such as nlvm.usu.edu/en/nav/vlibrary.html; or a literacy site with good content written at a higher reading level than the students can manage, for example, magickeys.com/books. A third-grade teacher combined an exploration of the Scholastic Interactive Tour of Ellis Island site (teacher.scholastic.com/activities/immigration/tour) with a series of primarysource photographs of immigrant families to trigger rich conversations about what students noticed. Placing a 3D object on a document camera allows simultaneous examination of its details. For instance, one teacher placed a series of rocks and gems on the document camera and asked students to identify and classify them.
Review Information
Some teachers like to download or create games for whole-class reviews of content, especially before a test or to teach test-taking skills. Students can also create their own electronic K-W-L (What I Know, What I Wonder, and What I Learned) charts and revisit them every week or so to update their accomplishments. In one middle-school classroom, the teacher periodically displays the pretest questions and asks students to answer them; this shows them how much they have learned and encourages them to continue learning. A group of teachers displays student-created slideshows to review vocabulary words. Some teachers use Kahoot! (kahoot.com/welcomeback), an online interactive quiz platform, as a formative assessment tool. In Kahoot, although students type in aliases to identify themselves publicly, the teacher can see their real names and their answers.
Respond to or Critique an Idea or Sample
Having trouble getting students to work toward excellence in their projects? Show an example from an earlier year or one you’ve made, and have students create a rubric based on their critique of the sample. Writing lessons lend themselves to critique; with a student’s permission, teachers can show a sample and ask the class to discuss the strengths of the work along with ideas for improvement.
Engage Students in Thinking about and Discussing Ideas
As a warm-up for teaching thinking skills, a teacher showed one-panel comics and asked students to think about what was happening to the characters in the comic, as well as outside the comic—that is, what actions might have occurred before and what actions could occur later, as a result of the comic situation. Comics can teach inference, vocabulary, punctuation conventions, visual literacy, and sometimes even cultural references.
Another teacher often used provocative editorials for students to analyze. They considered where and why the arguments were strong, misleading, or misinformed. The goal was critical thinking about persuasive writing, and students loved the activity.
Concept cartoons are excellent ways to generate conversations and tease out possible misconceptions. In a concept cartoon, characters make statements about a concept, one that the teacher is introducing or one that the students are studying. Each character takes a different point of view, with several characters stating misconceptions that students may have. Students think about the statements and align themselves with one viewpoint. Through discussion, students eliminate incorrect or illogical ideas to identify the correct concept.
A variation of the concept cartoon would show characters making statements representing various points of view about a topic on which students have different opinions. For instance, the comic characters could disagree about a decision made by a character in a book they have studied, or the disagreement could be a debate on the best location for NASA’s next exploration. This type of dialogue helps students learn about and understand valid points of view that may differ from their own.
Figure 5.5. Concept cartoon created by Boni Hamilton in Comic Creator at ReadWriteThink (readwritethink.org/files/resources/interactives/comic).
Reach beyond School Walls
If you want students to be excited about learning, use the internet to connect with someone in another location, even a classroom down the hall. The potential for teleconferencing boggles the mind. Students can talk to experts, students in other classrooms, and individuals who are exploring unusual places or creating fascinating objects. In one school, students kept in contact with a young man as he hiked across several countries. One teacher used Skype as a classroom management reward: When students earned enough good behavior points, they called the teacher’s mother and met the teacher’s dogs.
The use of technology tools for visual learners balances the auditory/verbal activities that normally predominate in the classroom environment. When teachers increase the visual stimuli they allow students to use in the classroom, they notice an increase in student engagement, particularly for students who struggle to complete text-based tasks. In addition, all students, no matter what their learning preferences, benefit from projects and ideas that encourage the use of visual skills.
Presentation Slideshows as Instructional Material
Fifteen Fabulous Visual Projects
1. Drawings. Draw a visual representation of a vocabulary term or a scene from a book.
2. Show What You Know. Draw and label a content concept such as a life cycle or a chemical element.
3. Build an Avatar. Design a portrait for an online profile.
4. Graphic Organizer. Create a visual organizer from scratch.
5. Event Timeline. Sequence an event with pictures and captions.
6. Illustration. Illustrate a writing project or a complex procedure.
7. Sequence Slideshow. Picture the steps to a sequence in a slideshow.
8. Visual Dictionary. Illustrate idioms or social studies terms.
9. Cartoon. Develop a cartoon with a political message or as a public service announcement.
10. Map a Route. Trace the westward movement or the settlement of your state.
11. Graph It. Collect and display data.
12. Document. Build a documentation panel about safe online searching or research processes.
13. Augment. Use augmented reality to enhance a report.
14. Historical Dialog. Import historical photos and add dialog boxes.
15. Book It. Create a wordless picture book from self-produced photos.