To give you a better understanding of people we got in touch with, their demographics, intentions and preferences, we would like to show you full results of the survey.
1. Demographics
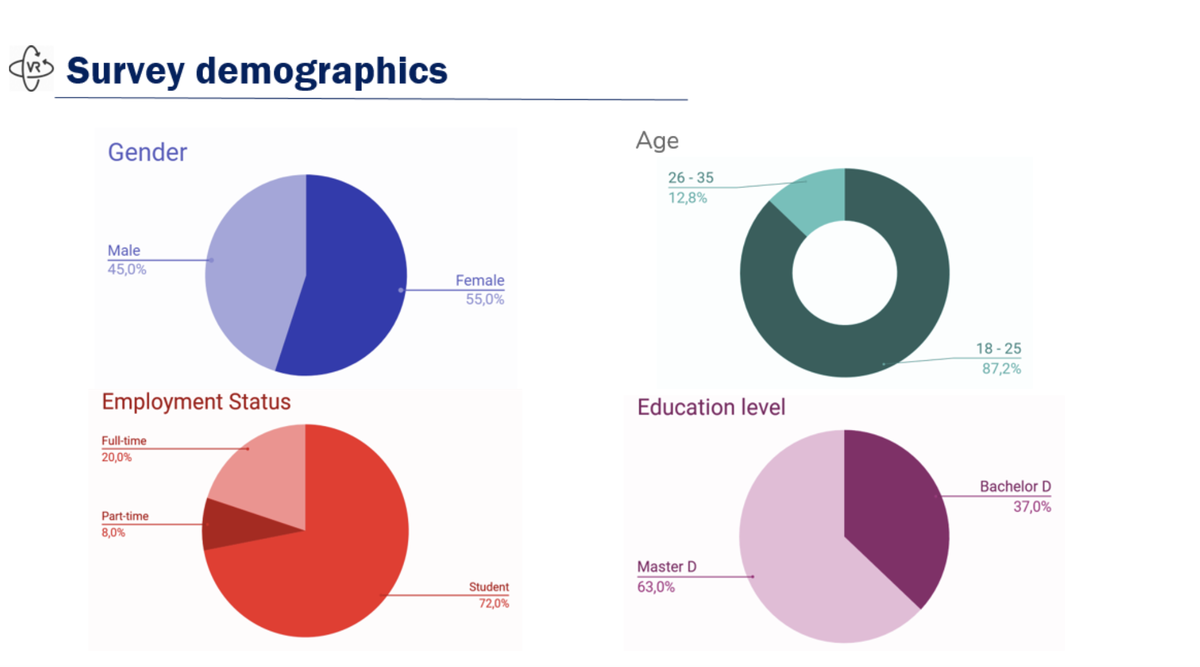
Gender split of the respondents was almost equal: 55% females and 45% males
The age was pretty much homogenous - the overwhelming majority was in the age group 19-25 y.o., and only some of the respondents from the age groups 26-35 y.o.
72% of the respondents were not working students and 28% were workers either full-time (20%) or part-time (8%).
Finally, the highest achieved educational level of the respondents was Bachelor degree for 37% and Master degree for 63%.
2. Information about event people attend
In the survey we asked about events people visit, what are those events, why people attend (or don't) them and how often they do it.
In the end we got the following results:
- 95% of people go to live events at least once a year; while 30% do it 1-2 times, 37,5% do it 3-6 times, 25% do it 7-12 times and only 2,5% do it more than 12 times per year
- The most popular are: music concerts, sport games and festivals of all kinds (60%, 57% and 50% of respondents accordingly picked them up - this was a multiple choice question, that's why sum will not be equal to 100). Theatre (37,5%) and conferences (35%) were not that popular among our respondents
- The reasons why people attend events were mostly, that they like atmosphere (75%), have fun (55%), spend time with their friends (47,5%)
- 75% said that it happens "sometimes", when they are unable to attend they event they wanted to, 25% said that it happens "often". It's interesting to note, that none of them chose the answer "never"
- The main reasons for not going were: events are located in other city (75%), they are too expensive (60%), people don't have time (42%), tickets are sold out (42%), people either hate crowds (30%) to don't have company (10%)
3. Information about broadcasting of events
Here we wanted to understand, if people watch broadcasted or online events and what are they
- the majority (47,5%) watches online-broadcasting of events "sometimes" or rarely (35%). Only 10% of the respondents claimed to do it often. Basically we got the same results (with deviations about 5%) for the video-recorded events
- about the kinds of events, people watch, the results were pretty much the same as for the events, they attend, with one interesting distinction - the third most popular became conferences instead of festivals.
4. Information about the VR technologies
Finally, we wanted to find out information about the VR
- 57,5% of the respondents said, they have never tried VR, and subsequently 82,6% of them said they would like to do it
- for the people who tried, it mostly was gaming (70,6%), virtual tours (47,1%) and entertainments (35%)
- the majority (76,5%) liked the experience they had with VR
5. Information about our future product
In the very end of the survey, we ask several questions that could help us with the marketing strategy for our product
- fist of all, 89% of respondents said they would like to watch live events through VR
- kinds of events were pretty much the same: music concerts winning it all (72,2%), sport games (47,2%) and festivals (44,4%) following
- the most important features of the future product for people were: quality of image and sound (scored 5 out of 5 in 75% of responses) and variety of content (scored 4 or 5 in 80% of responses)
- the majority (66,7%) of the respondents would like to rent our product occasionally, while only some were ready to buy it or rent with monthly subscription (25% and 16,7% accordingly)
- finally, regarding the place of use, 91% were ready to use it at home, and 47,2% wanted also to use it at a special place, like theatre (this question also was a multiple choice)
- we also asked about, how much people would be ready to pay for VR broadcasting service, but it was an open question and we got were confusing results, from very small to very high sums
All in all, the survey showed us clear demand for our future product, if we provided it in good quality and good variety of content. The results also showed us, that it's better to focus on sports and music events.
The main weak point of survey is the age group of respondents - we did not manage to get anybody 35+.