
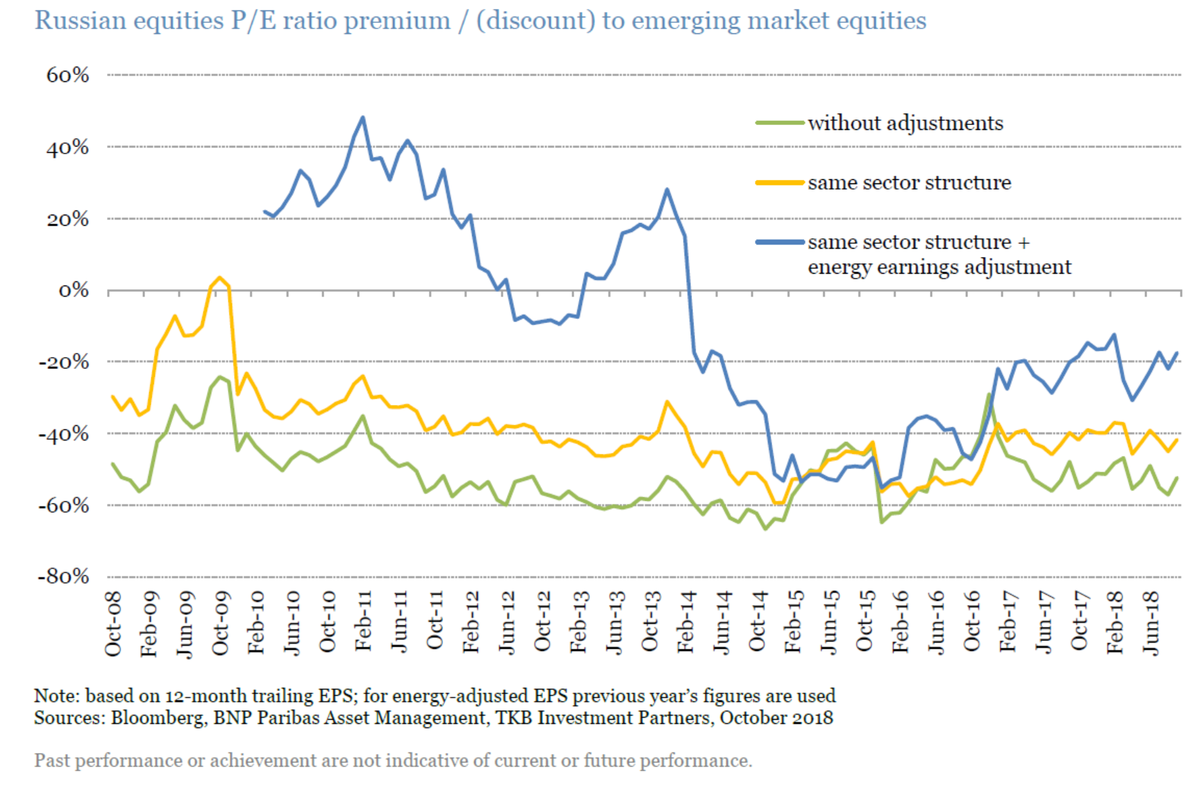
“Russia is always cheap” is common notion among investors. At first glance it appears to be true. Over the last decade the average price/earnings (P/E) ratio discount for the MSCI Russia index to the MSCI Emerging Markets index was 50%. Russian equities were never close to broader emerging market (EM) equities on a P/E ratio basis. However, upon closer inspection this structural cheapness is actually a myth due to:
- The difference between the structures of the Russian and EM equity indices. The MSCI Russia index has large weights in mature, highly cyclical energy (59%) and materials (14%) stocks, which tend to be cheap relative to the broader market. The MSCI EM index has larger weights in new high-growth, high return sectors such as IT (27%) and consumer discretionary (9%), which tend to command a premium valuation relative to the overall market. If one adjusts for these differing weightings, the average P/E discount for Russia comes down from 50% to 40%.
- Energy sector earnings are of poor quality, as depreciation does not fully reflect the amount of maintenance capital expenditure that energy companies have to undertake. If one adjusts energy companies’ earnings accordingly in addition to the previous adjustment, the average P/E discount for Russia falls to 7%.
It is always possible to find undervalued companies and earn excess return. The Parvest Equity Russia and Parvest Equity Opportunities funds outperformed their benchmark by 3.7%-4.2% per year on average during 2010-20181 (in US dollar terms, gross of fees).
Myth: Russia is always cheap
The difference between the structures of the Russian and EM equity indices distorts the apparent relative valuations.
Would you be surprised to see that there is a systematic discount on the P/E ratio of the energy sector vs. that of the IT sector? Probably not. The energy sector is mature and highly cyclical, so energy stocks tend to trade at below-average earnings multiples – for example the P/E for EM energy is 9.8x vs. 12x for the overall MSCI EM index. On the other hand, IT is a new industry with high returns and growth, and tends to trade at a premium (14.6x vs. 12x).
The IT sector is the largest in the MSCI EM index, with 27% vs. 0% in the MSCI Russia index. The energy sector has the largest weight in the MSCI Russia index, with 59%, vs. 8% in the MSCI EM index.
The relative valuation picture is different once you compare bananas to bananas in terms of sector weights: using the MSCI Russia sectoral weights structure for EM index to get an aggregate P/E ratio. The average P/E discount for Russia has been 40% over the last 10 years when viewed with this adjustment.
Energy sector earnings are of poor quality
This is mainly for Gazprom. Adjusting for Gazprom’s earnings power is crucial when assessing the energy sector discount and the overall market discount. Its average weight in the energy sector has been 40%. At first glance the company has high earnings. Its earnings yield ratio (E/P) has remained high over a long period – 27% on average for the last 10 years. This gives a misleading picture of the company’s actual ability to earn money for its shareholders. The company systematically spend large sums of money on investments other than expansion. For example, Gazprom has been building gas pipelines to diversify its export routes, but these have not increased its production levels. In addition, the company needs more money to maintain its production facilities than the depreciation and amortisation figures imply. When we adjust the company earnings for this stay-in-business CAPEX, we see that the earnings yield shrinks by almost half – from 25% to 14%. Its P/E of 4 becomes a P/E of 7. Other energy companies also earn less than their earnings figures suggest, although they distort the apparent relative valuations by much less than Gazprom as the difference between their adjusted and reported earnings is smaller.
After adjustment for stay-in-business CAPEX, the P/E discount of the Russia energy sector vs. the EM energy sector turns into a premium for some of the periods. Between 2010 and 2013, the premium was mainly due to the gas producers, Gazprom and Novatek. Now oil producers are responsible for the premium.
Reality: It is always possible to find undervalued companies and earn excess returns
We found many undervalued stocks during 2010-2013 when the Russian market was trading at a premium to the EM index. As a result, over this period, the Parvest Equity Russia and Parvest Equity Russia Opportunities funds outperformed their benchmark by 3%-4%2 a year on average.
We found many undervalued stocks during 2014-2018 when the Russian market was trading at a discount to the EM index. As a result, over this period, the Parvest Equity Russia and Parvest Equity Russia Opportunities funds outperformed their benchmark by 3%-5%2 a year on average.