Acoustic Indicators — A New Class of Analytical Systems
The architecture of acoustic indicators emerged from the idea of musical signal processing, where the focus is not on values but on states and transitions.
The idea is fully implementable in the form of indicators.
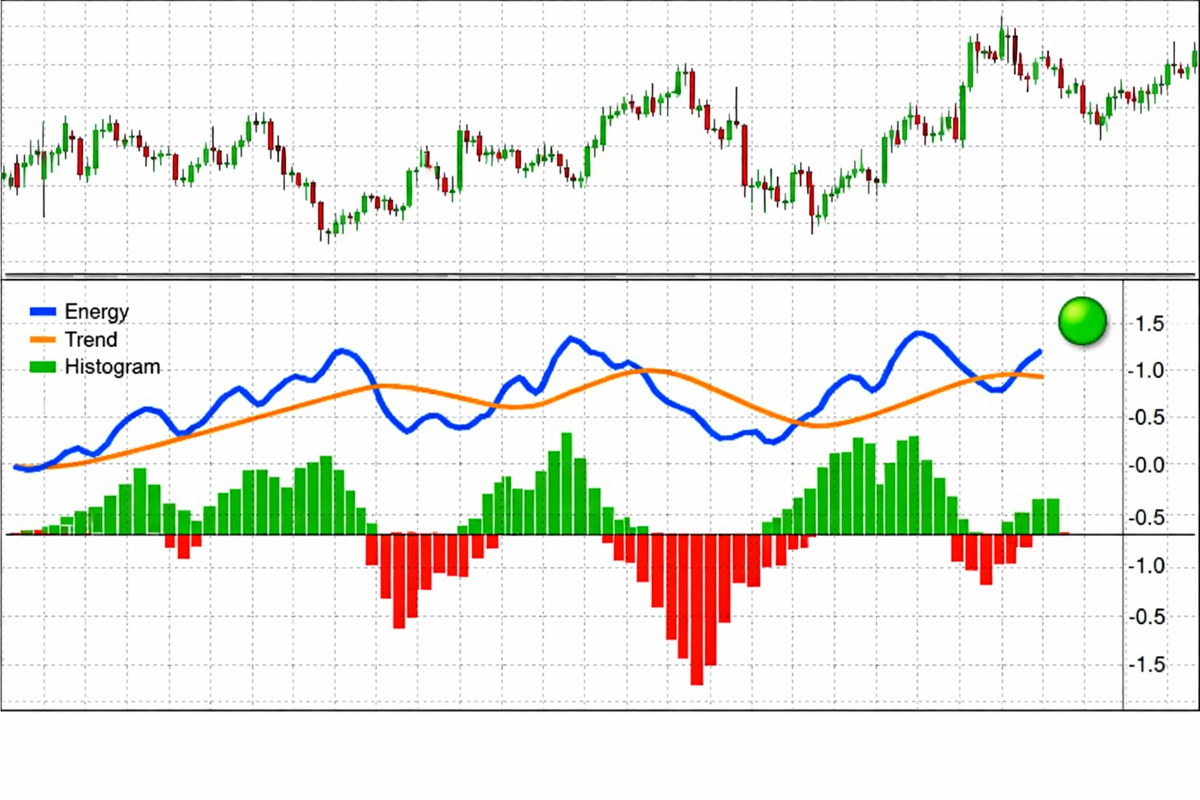
The example image shows an indicator created as a mix of Boogie‑Woogie and Twist.
Section 1 — purpose of the concept
Acoustic indicators are proposed as a new type of analytical tool. The main idea is to use a musical signal and convert it into structured data that can then be applied in indicators and computational models. Music in this specific case can be considered a physical process with its own laws, vibrations, and spectral structure. The market, on the other hand, remains an abstract system where data is represented only by numbers.
Music is capable of forming stable geometric structures. An example is the Chladni figures, where vibration forces material to arrange itself into various patterns. These patterns directly depend on frequency and amplitude. This principle shows that sound is capable of creating form, and without understanding this, it is impossible to grasp the essence of acoustic indicators.
My concept is to show that a musical signal is real, measurable, and can be used to create a new type of indicator. The visual appearance of the indicator is determined by the properties of sound, not by design decisions.
Section 2 — architectural logic of the contour approach
It helps us interpret the structure of sound more precisely but does not define its foundation. My acoustic approach to trading is built on multilayered perception of sound. Just as music has a main contour, additional supporting elements, and subtle shades, the architecture of the indicator contains analogous layers.
Keeping the Chladni figures in mind, we see that when frequency changes, the pattern rearranges but remains governed by physical laws. The same happens with the musical signal inside the indicator. It defines a structure that may be complex but always follows a pattern.
Both the market and music are expressed through numbers, but the nature of these numbers is different. Music is a physical signal that can be measured and described. The market is a model of human behavior. Therefore, it is reasonable to assume that a musical signal can serve as a more stable foundation for both code and visual representation.
Level A (main musical contour)
This level conveys the fundamental shape of the sound: dynamics, strength, direction, and character of movement.
Level B (contextual musical layer)
This layer adds elements that expand the perception of the main contour.
Level C (soft musical shades)
Here the nuances of timbre and subtle changes in the character of the sound are reflected.
Section 3 — the main musical contour
This level describes the basic properties of the signal: shape, strength, rhythmic structure, and overall dynamics. Music can be measured with numbers: amplitude, frequency, spectrum, etc. — these are real quantities.
Section 4 — the contextual musical layer
This layer can expand the perception of the main contour and participates in decision‑making.
Section 5 — soft musical shades
This is a source for additional observation of the acoustic indicator: timbre, coloration, soft changes in character. They are auxiliary and do not fundamentally affect calculations.
Section 6 — the principle of stability
The main musical contour must remain stable. Contextual elements do not dominate the base, and shade‑level features do not participate in calculations. This ensures clarity of perception and prevents distortion.
Section 7 — converting music into indicator code
I insist that a musical signal can be converted into code suitable for writing an indicator through an algorithmic protocol. Music is a physical process. Chladni figures demonstrate that vibration can be translated into a visual structure. The same analogy applies here: the shape of the indicator is born from the properties of sound.
The market is an abstract model of human behavior, so an acoustic signal can become a stable foundation for building structures.
Section 8 — visual representation as a consequence of sound properties
The visual appearance of the indicator is determined by the characteristics of the musical–acoustic signal. This is not a design choice but a consequence of the code after processing through the protocol. Chladni figures confirm that sound forms structure.
The musical signal defines parameters such as line shape, density of elements, smoothness of transitions, and distribution vertically or horizontally. Different acoustic indicators may look similar externally but are not required to behave the same, because their visual form and behavior are determined by the music from which they are created.
Section 9 — placement of the indicator
The musical signal also influences where the indicator is placed in the chart window. If the structure defined by acoustics appears as a main contour, the indicator is logically placed on the main chart. If the musical form is a supporting layer, the indicator goes to a subwindow. If shade‑level elements are present, hybrid options are possible.
Section 10 — connection to market analysis
Through acoustic indicators, I propose a new way of perceiving data. I suggest viewing the market as a process that can be interpreted through musical logic: form, rhythm, dynamics, and character of changes. Music is physics; the market is abstraction.
Section 11 — structural perception model
The structural model of the protocol includes observation levels analogous to musical structure: main contour, context, and shades. I do not use formulas or mathematical calculation algorithms.
Section 12 — final principle
Acoustic indicators are a new class of tools with no global analogues. A musical signal, as a physical process, is transformed into a code structure, visual representation, and indicator placement on the chart. External similarity does not imply identical behavior. Different underlying music forms different models of market perception.
Section 13 — conclusion
In this article, I attempted to describe the concept of acoustic indicators as a new class of analytical systems. My article calls attention to the difference between the physical nature of music and the abstract nature of the market, and to their possible interaction. Music determines the code, the visual representation, and the placement of the indicator.
Section 14 — indicator input variables
An acoustic indicator requires a set of input variables that can reflect musical properties and convert them into code. These include parameters of energy, trend, impulse, rhythm, and visual representation. All variables are tied to the musical model and cannot be changed arbitrarily. Their configuration must strictly follow acoustic logic.
The indicator behaves like a musical composition: the central line breathes, impulse elements form rhythm, energy defines the character of movement. Its behavior fully corresponds to the work of an acoustic operator on a submarine or in other fields. The market is read as a musical structure where micro‑changes create overall dynamics. Acoustic indicators, figuratively speaking, do not “draw the market” — they perceive it as sound. They listen to the market just as a submarine acoustician listens to the ocean, capturing deep vibrations and hidden impulses.
Structural reference for some main groups of input parameters:
– energy parameters defining sensitivity to loudness;
– trend parameters defining the musical phrase through EMA;
– impulse parameters regulating attack strength;
– rhythm parameters reflecting the sequence of steps;
– visual parameters controlling the display of elements.
All variables tied to the musical model cannot be changed arbitrarily. Their configuration must follow acoustic logic: energy not below the perception threshold, trend not without EMA, impulse not without attack, rhythm not random. Since the indicator’s input variables are based on the musical model, their behavior must reflect not mathematical abstraction but the properties of sound. Music is a process that lives through micro‑rhythm, micro‑dynamics, and shifts of the composition’s energy center. This is why the indicator behaves like a musical composition: the central line breathes, impulse elements form rhythm, and energy sets the tone and character of movement. For some, the market looks chaotic; for others, structured. In the acoustic approach, it is read as a musical composition where micro‑changes reveal the overall dynamics. This explains why the indicator reacts not to individual candles but to changes in balance — just as music reacts not to individual notes but to their relationships.
P.S. Many people encountering this idea for the first time will call it a “musical indicator.” This is a predictable mistake: from the outside it may indeed look like an attempt to “attach music to a chart.” But acoustic indicators are neither a metaphor nor an impressive fantasy. They are an independent engineering technology that perceives the market the same way a person perceives music by ear: holistically, through the character of movement, dynamics, and internal resonance.
This is why the request (from those who want to replicate the technology) “make a musical indicator” will not work when addressed to a neural network. The neural network does not understand what exactly must be created: it does not know how acoustic patterns relate to market data. Without an architecture, without a model, without a protocol–algorithm of transformation, it produces fantasy — because it is obligated to output something, but lacking reference points, it will produce nonsense.
What people will call a “musical indicator” is in fact an acoustic construction where perception becomes structure, structure becomes a model, the model becomes visual representation, and visual representation becomes an analytical tool. For this to work, one must understand impulse mechanics, phase transitions, micro‑movements, dominant sides, and be able to think broadly — to see data as a form of sound, and sound as a form of data.
A neural network cannot replace a human as an architect. It can amplify any concept if that concept exists, but it remains powerless when the concept does not. Acoustic indicators are not a “musical idea” but a technology that cannot be obtained through a simple request. They are the result of structural‑architectural thinking, an engineering approach, and an understanding of how the market sounds within its own dynamics.
[Introduction — what problem the article solves]
…
Most indicators operate on the same principle: price is taken, run through formulas, and a result is produced. But these tools, in my view, do not provide a new way of seeing the market because they rely on the same mathematical approaches. The article raises the problem of the absence of alternative models that rely not on abstractions but on real physical processes.
[How the problem is solved]
…
I propose viewing the musical signal as a source of structure for an indicator. Sound is physics: frequencies, amplitudes, vibrations. These parameters can be converted into data and used to build an indicator. This approach makes it possible to create a visual representation formed not by formulas but by the properties of a real acoustic signal. It provides a different way of looking at the market — as a living process.
[Conclusion — what the reader gains]
…
The real value of such concepts is that the trader begins to see the market more broadly and eventually creates their own conceptual ideas instead of merely copying someone else’s technical solutions (although even borrowed tools can sometimes be useful). When a trader understands how an idea is born, how it is shaped, and why it works, they gain the ability to build their own models and solutions rather than depend solely on ready‑made indicators. In essence, this is the development of lateral thinking, which then directly affects trading practice.