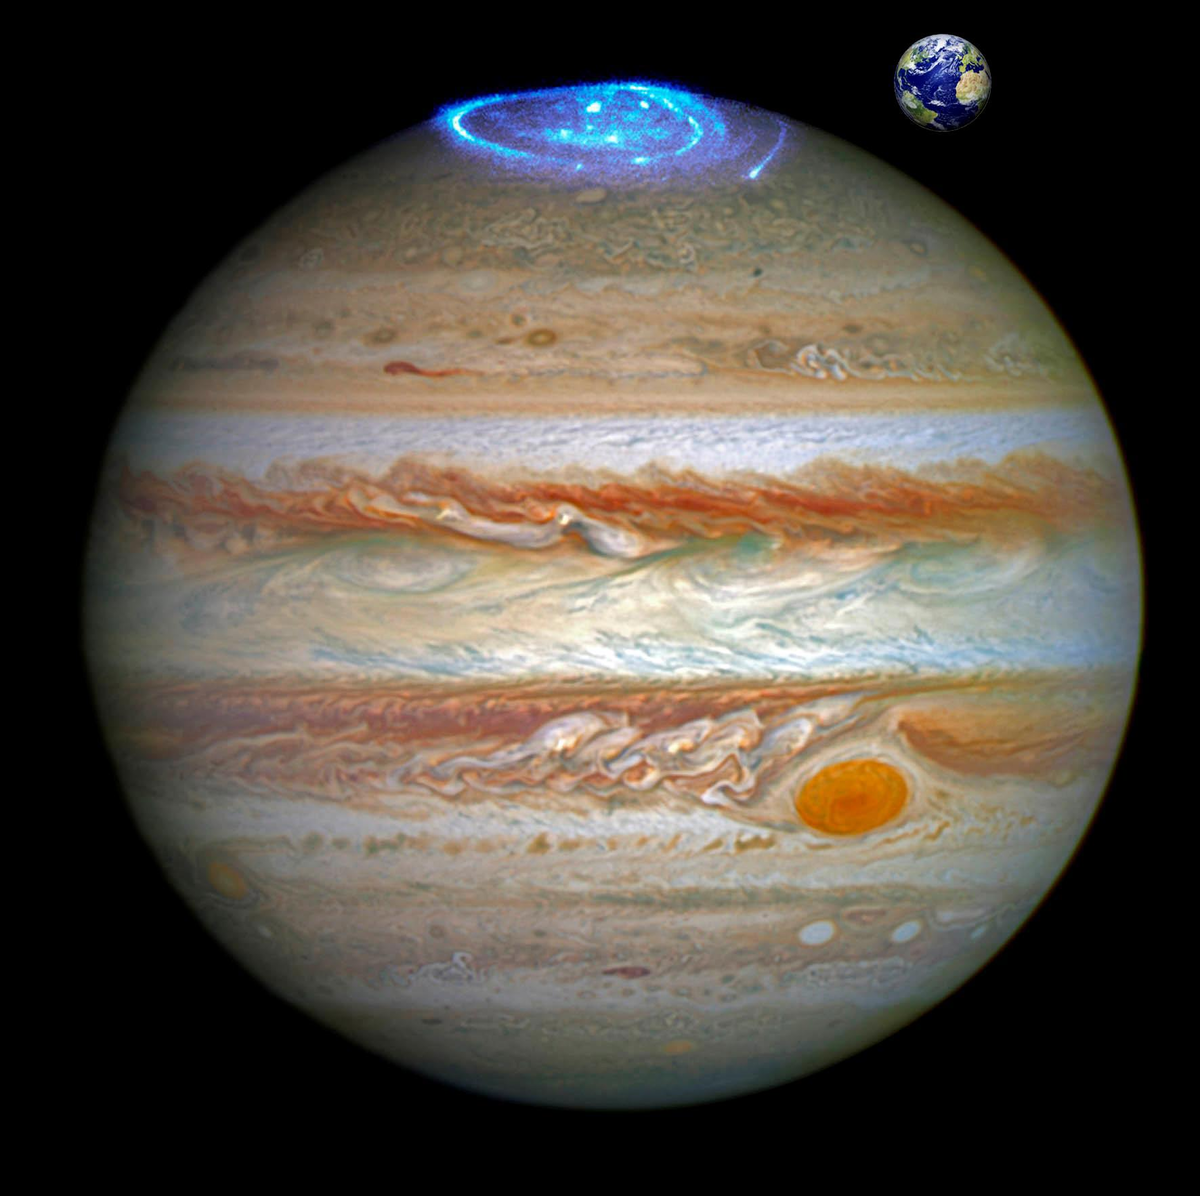
Согласно новому исследованию, проведённому учёными из Национального института астрофизики Италии и Университета Нагои в Японии, газовый гигант Юпитер сформировался примерно через 1,8 миллиона лет после зарождения Солнечной системы. Этот вывод был сделан на основе изучения происхождения хондр — микроскопических капель расплавленной породы, обнаруженных в примитивных метеоритах, хондритах. Исследователи предполагают, что стремительный рост Юпитера дестабилизировал орбиты планетезималей, небольших каменных и ледяных тел, что привело к их столкновениям на скоростях свыше двух километров в секунду.
Эти удары генерировали чрезвычайно высокие температуры, достаточные для плавления твёрдого материала планетезималей. При наличии воды мгновенное испарение льда вызывало микроскопические взрывы, которые дробили расплавленную породу на мельчайшие капли, быстро застывавшие и превращавшиеся в хондры.
28 52 20 24 63
26 10 62 45 50
42 60 59 84 60
86 32 30 38 40
Проанализировав размеры и свойства охлаждения хондр, найденных в метеоритах, авторы работы идентифицировали именно этот механизм как основной для их формирования. Поскольку метеоритные данные указывают на то, что пик образования хондр пришёлся на период 1,8 миллиона лет после начала формирования Солнечной системы, учёные пришли к выводу, что в это же время сформировался и Юпитер.
Данная оценка делает формирование газового гиганта на один-три миллиона лет раньше по сравнению с предыдущими расчетами.
Предложенная модель впервые объясняет физические характеристики хондр, такие как их небольшой размер и быстрое охлаждение, без необходимости привлекать условия экстремальных процессов в первичной солнечной туманности.
Ключевую роль в этом механизме сыграла вода.
Мгновенное испарение льдов во время столкновений создавало локализованные паровые взрывы, которые дробили породу и способствовали быстрому рассеиванию тепла. Таким образом, расплавленный материал разделялся на мелкие силикатные капли, которые затвердевали почти мгновенно.
Это открытие не только проливает свет на происхождение хондр, но и предоставляет новое временное ограничение для формирования Юпитера. Исследование подчёркивает, что рождение планеты-гиганта не было изолированным событием, а стало неотъемлемой частью процессов, сформировавших структуру и состав всей Солнечной системы.
Способность молодого Юпитера вызывать высокоэнергетические столкновения, вероятно, повлияла также на формирование и эволюцию малых тел, оставив неизгладимый след в метеоритах, которые мы изучаем сегодня.
По мнению авторов, другие планеты-гиганты, такие как Сатурн, могли вызывать схожие явления в период своего образования. Таким образом, будущие исследования метеоритов и содержащихся в них хондр могут помочь восстановить последовательность формирования планет и улучшить наши знания о хронологии эволюции Солнечной системы. Исследование было опубликовано в журнале Scientific Reports.
new-science.ru/ jupiter-formirovalsya-vsego-cherez-1-8-milliona-let-zarozhdeniya-solnechnoj-sistemy
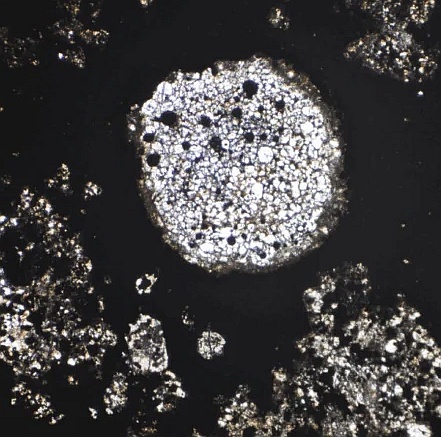
Chondrules are spherical or subspherical particles of crystallized or partially crystallized liquid silicates that constitute large-volume fractions of most chondritic meteorites. Chondrules typically range 0.1−2mm in size and solidified with cooling rates of 10−1000Kh−1, yet these characteristics prove difficult to reconcile with proposed formation models. We numerically show that collisions among planetesimals containing volatile materials naturally explain both the sizes and cooling rates of chondrules. We show that the high-velocity collisions with volatile-rich planetesimals first induced in the solar nebula by Jupiter’s formation produced increasing amounts of silicate melt for increasing impact velocities above 2kms−1. We propose that the expanding gas formed from volatile materials by collisional heating dispersed and cooled the silicate melt, resulting in droplet sizes and cooling rates consistent with the observed sizes and inferred cooling rates. We further show that the peak melt production is linked to the onset of Jupiter’s runaway gas accretion, and argue that the peak age of chondrules points to Jupiter’s birth dating 1.8 Myr after CAIs.
Introduction
Chondrules are spherical particles of crystallized liquid silicates that constitute large volume fractions of chondritic meteorites. Chondrules typically range 0.1–2 mm in size1 and solidified with estimated cooling rates of 10−1000Kh−1. The widespread presence, high volume fraction (exceeding 80% in ordinary chondrites) and spherical (or subspherical) shape of chondrules suggest that they originated from an unknown melting process occurring ubiquitously in the solar nebula. The 26Al-26Mg age of the oldest chondrules dates the time of this ubiquitous melting process to 1.8Myr after CAIs (Ca–Al-rich inclusions) using the canonical 26Al/27Al value 3.
Because of their fundamental role in planet formation, collisions between planetesimals are such a ubiquitous process and, consequently, the collisional production of melt droplets has been proposed as the chondrule formation mechanism since the early 1950s.
The environmental conditions of the solar nebula required to collisionally form chondrules, however, are still a matter of debate.Low-velocity collisions like those occurring in unperturbed protoplanetary disks (∼100ms−1) can produce silicate melt droplets if the interior of the impacting planetesimals is molten.
While the existence of early-formed differentiated planetesimals in the inner Solar System is confirmed by meteoritic data, melt droplets resulting from their impacts can form large chondrules because the surrounding nebular gas is too rarefied to break them down to millimeter sizes. If the nebular gas is sufficiently dense, however, melt droplets of small sizes can be formed. In planetesimal disks characterized by high collisional velocities (>2.5kms−1) the impact jetting process can produce melt droplets consistent with the observed sizes and cooling rates. However, the favoured impact jetting scenario requires the widespread presence of massive planetary embryos, whose escape velocities can cause impacts at velocities above 2.5kms−1, and is more effective in producing chondrules in the orbital region of the terrestrial planets than in the asteroid belt. Recent work indicates that impact jetting can produce chondrules also across the outer Solar System and can result in the in situ production of carbonaceous chondrules (CC). However, this process requires extended growth times of Jupiter’s core since the onset of its runaway gas accretion promptly halts chondrule production by impact jetting.
Recent observational and theoretical results reveal that protoplanetary disks cross primordial phases of dynamical and collisional excitation of their planetesimals when their first massive planets form. Collisional studies consistently show that this process is effective in producing high velocity collisions among primordial populations of planetesimals even in the absence of planetary embryos.
The comparison of disk population studies with the estimated enhancement in the abundance of disk dust caused by these collisions point to typical formation timescales of 1-2 Myr for giant planets, in contrast with the requirement of extended formation timescales of Jupiter’s core to sustain impact jetting in the outer Solar System. In the inner Solar System the asteroid belt is the first orbital region to become collisionally excited as a result of Jupiter’s formation, with the intensity of its collisional evolution being linked to Jupiter’s migration. Jupiter’s appearance also triggers the first injection of volatile-rich planetesimals inward of the water snowline, the magnitude of this process also depending on Jupiter’s migration.In this work we show that the Jupiter-driven dynamical excitation of volatile-rich planetesimals capable of high-velocity impacts on planetary bodies in the asteroid belt makes it possible to reproduce the chondrule size range even in the case where the target planetesimals are not characterized by a fully molten interior due to heating by decay of 26Al. Specifically, the sublimation and expansion of volatile elements in the impacts make it possible for the melt droplets to break down to the observed millimeter sizes. To this end we conducted detailed numerical simulations of the planetesimal dynamical excitation induced by Jupiter’s formation using the Mercury-Arχes parallel n-body code, and characterized the planetesimal collisional environment using statistical collisional methods (see Methods). Because of the uncertainty on Jupiter’s formation and migration history, we follow the approach of previous studies and consider both the classical scenario of in situ formation and a scenario with extensive migration where Jupiter starts its growth beyond the N2 snowline.
Formation of melt by individual planetesimal collisions
To quantify the amount of silicate melt produced by planetesimal impacts and inform our global melt production computations, we simulated head-on collisions of two spherical planetesimals using the iSALE shock-physics code. The reference simulations involve planetesimals of 100 and 400 km in diameter, respectively, although we tested multiple combinations of target and impactor sizes (see Methods). The impacting planetesimals are described by the equation of state of dunite for simplicity. As the addition of large amounts of volatile materials (especially water) can reduce the amount of melt, in analyzing our results we regard our estimates of the melt production as upper bounds and account for a possible reduction up to a factor of 10 when the water mass fraction is 20%. As we discuss in the following, this inhibiting role of volatiles in the collisional production of melt could have played a key role in the petrogenesis of the different classes of chondrites. On the other hand, the amount of melt can be larger than in our simulations if the interior of the target planetesimal is molten as expected in the case of the earliest generations of planetesimals in the inner Solar System. The full set of input parameters for the impact simulations are shown in the Methods.The impact velocity is varied between 1 and 10 km s−1 based on our n-body simulations (see Methods). The porosity of the planetesimals depends on whether and to which level they experience sintering, melting and compaction, which in turn depends on the formation time and place of the planetesimals.
As our main investigation focuses on target planetesimals formed in the inner solar system and impactors formed in the outer solar system (see Methods), in the iSALE simulations the porosity of the 100 km impactors is varied between 0.1 and 0.9 under the assumption they underwent moderate to no melting due to the offset in the planetesimal accretion time between inner and outer Solar System. The target planetesimals with a diameter of 400 km are assumed to have zero porosity to represent internally-evolved planetary bodies, consistent with the density data for the differentiated asteroid Vesta provided by the HED (Howardite–Eucrite–Diogenite) meteorites and the NASA mission Dawn. The target planetesimal would be volatile-poor due to the likelihood of volatile loss during low-temperature thermal metamorphism and, depending on its degree of internal evolution, could be limitedly or highly depleted of iron throughout its mantle because of Fe migration or FeS percolation toward the core, the latter process not requiring the global melting of the planetesimal. Figure a shows a time sequence of the evolution of the melt production in a collision with an impact velocity of 5 km s−1 between 100 and 400 km diameter planetesimals with an impactor porosity of 0.4. Even at an initial temperature of 200 K, characteristic of equilibrium with the nebula gas at about 2 AU (see Methods), the surface around the impact point is melted, and the melt fraction approaches unity. Because the ANEOS equation of state does not include the phase transition (i.e., melting and vaporizing), the melt fraction is estimated from entropy,
The entropy at the incipient and complete melting at 105Pa are 2.35kJK−1kg−1 at 1373K and 3.31kJK−1kg−1 at 2173 K, respectively.
Thus, the melt fraction of 0.5 roughly corresponds to (1373+2173)/2≃1800K.
The melt is produced around the impact site and spreads laterally as the target deforms. When t=75s, the amount of melt reaches a maximum of 80 % of the impactor mass. The thickness of the melted layer around the impact point is ≃35 km at 25 s and decreases to 10 km at 75 s after the collision. The melt layer expands horizontally as the target planetesimal breaks up. Figure 1b shows the total amount of melt produced in a collision as a function of the impact velocity. If the impact velocity is higher than 6kms−1, the melt mass exceeds that of the impactor, reaching up to a few percent of the mass of the target. The impactor porosity dependence is shown in Fig. 1c. It can be seen that the amount of melt increases as porosity increases, and is twice that of 0.4 at 0.7. The porosity of 0.4 is adopted based on the density data for the Saturnian satellite Phoebe from the NASA mission Cassini but could be lower for impactors that are thermally evolved. The normalized amount of melt decreases to 0.12 for zero porosity from 0.53 for porosity of 0.4 at an impact velocity of 4kms−1.
Global melt production caused by Jupiter’s formation
By combining the melt production by individual impacts as a function of the impact velocity simulated with iSALE (Fig. 1b) with the average impact velocities and the number of impacts computed by processing the n-body simulations (see Methods), we characterize the average melt production rate across the inner Solar System as a function of time in both Jupiter’s in situ formation and extensive migration scenarios (Fig. 2). As presented above, the melt production we adopt is the result of the reference vertical collisions simulated with iSALE, where volatile material is not included. Therefore, the global amount of melt determined from processing the n-body simulations should be regarded as an upper bound.The results show that the timing of peak melt production immediately follows the onset of the runaway gas accretion onto Jupiter, consistently with previous studies showing that peak collisional excitation is reached about 0.1 Myr after runaway gas accretion begins15,19. Melt production by impactors originating beyond the water snowline is efficient between 2 and 4 AU with the region between 3 and 4 AU being characterized by more intense and longer production with respect to the region between 2 and 3 AU (Fig. 2). The scenario with extensive migration produces about 0.2 M⊕ of melt (see inset in Fig. 2, right plot) and proves about an order of magnitude more efficient than the in situ formation scenario, which results in a total melt production of about 0.01 M⊕ (see inset in Fig. 2, left plot). The orbital region where collisional melt production is effective is consistent with the indications of origins close or beyond the water snowline from the oxidation states of the parent bodies of both carbonaceous and non-carbonaceous planetesimals39, as we will discuss when presenting the possible petrogenesis of the different classes of chondrites.Both Jovian formation scenarios produce masses of melt large enough to reproduce the present-day asteroid belt after accounting for the mass loss it experienced since its formation 40 and the uncertainties in the collisional melt production efficiency we discussed above. While not the direct focus of this study, our simulations also show that both Jovian formation scenarios result in compositional structures of the asteroid belt globally compatible with the present one, albeit they predict different origins for the volatile-rich asteroids (see Supplementary Information and Fig. S2).Fig. 1a: Snapshots of a head-on collision (impact velocity, 5 km s−1) between 100 and 400 km diameter planetesimals composed of dunite. The initial porosities of the 100 and 400 km planetesimals are 0.4 and 0, respectively.
From left to right, we show the collision after 0, 25, 50, and 75 s. Cylindrically symmetrical coordinates where the vertical (z) axis is the center of symmetry surrounded by the horizontal (r) axis are adopted. The color shows the volume fraction of the melt. The amount of melt reaches a maximum when t=75 s, at which time the melt thickness is 10 km at the central axis. b: The amount of the mass of melt normalized by the impactor mass Mmelt/Mimp as a function of the impact velocity with a fixed porosity of 0.4. If the impact velocity is faster than 6kms−1, the melt mass exceeds the mass of the impactor. c: The normalized amount of melt Mmelt/Mimp as a function of impactor porosity with a fixed impact velocity of 4kms−1.Full size imageFig. 2Temporal evolution of the collisional production rate of chondrules across the different orbital regions of the inner Solar System.
The collisional melt production in each annular region is computed by integrating over all impacts that occurred within its boundary in each temporal interval over which we resolve the collisional evolution (see Methods).
The left plot shows the scenario of the in situ formation of Jupiter, and the right plot shows the scenario of extensive migration of Jupiter following its formation beyond the N2 snowline. The peak efficiency in melt production is achieved between 3 and 4 au in both scenarios.
The insets in the plots show the cumulative production of chondrules over time, the sharp increase at about 1.8 Myr is the result of Jupiter’s runaway gas growth.Full size imageFig. 3a: Schematic of the initial geometry of the melt layer. The initial arrangement of the melt is approximated by the layer of thickness L0 covering a planetesimal of radius Rpla. b: Schematic of the melt layer expansion. Volatile material in the layer with thickness L0 evaporates and expands with a velocity vgas(r). Silicate melt is dragged by gas and has a velocity vmelt(r). The melt forms droplets of diameter D determined by the Weber number at which collisional equilibrium occurs.Full size imageFig. 4Results of the melt breakup simulation using parameters f=0.1, L0=10 km and m/mH=18. The horizontal axis is the distance r from the center of the target planetesimal normalized by the radius of the target planetesimal Rpla.
The dashed horizontal line is the breakup density, where the volume fraction of melt is 0.2. The initial surface of the melt layer is r/Rpla=1.1. b: evolution of the melt (vmelt) and gas (vgas) velocities. The melt component is dragged by the gas and vgas>vmelt. c: evolution of the velocity difference between gas and melt vgas−vmelt. d: Evolution of the distribution of the melt diameter D. The curve starts at r/Rpla=1.1 when t=27.5 and 55s because the breakup does not proceed at these periods.Full size imageFig. 5a: Evolution of the average droplet size for the simulation using f=0.1, L0=10km, and m/mH=18. The numerical result (solid) and analytical solution (dashed) (Eq.(22) are shown. The breakup of melt occurs (t/t0=75) when the melt volume fraction falls below53 0.2. b: Evolution of the temperature decrease. The solid (dashed) lines are the numerical results. The horizontal dotted line is 400 K, where the melt solidifies. Inset: evolution of the cooling rate. Solid (dashed) lines are the numerical results. c: Evolution of the location of the melt layer surface normalized by the planetesimal radius L(t)/Rpla. The dashed line is the least-square fit. d: Evolution of the average melt spatial density within L(t) normalized by the initial melt density ρmelt, av/ρmelt,0 (ρmelt,0=2047kgm−3). The dashed line is an approximated formula 3R02L02/L(t)3, where L(t) is given by the least-square fit in panel c.