📉 Footprint Charts 101: Let's Break It Down! Ever wondered what's cooking inside those candlesticks? 🤔 Footprints reveal the real action—who's buying, who's selling, and where the drama unfolds! Here's the scoop: ➡️ They display bid vs ask volume at each price level. ➡️ Check them out as volume clusters, profiles, or deltas. ➡️ Perfect for spotting absorptions, imbalances, and those sneaky trapped traders. ➡️ They unveil the true intent behind price moves—not just what happened! Footprints show not just where the price went but how it got there! 🔍💥 #TradingInsights #MarketMoves
📉 Footprint Charts 101: Let's Break It Down!
Ever wondered what's cooking inside those candlesticks? 🤔 Footprints reveal the real action—who's buying, who's selling, and where the drama unfolds!
Here's the scoop:
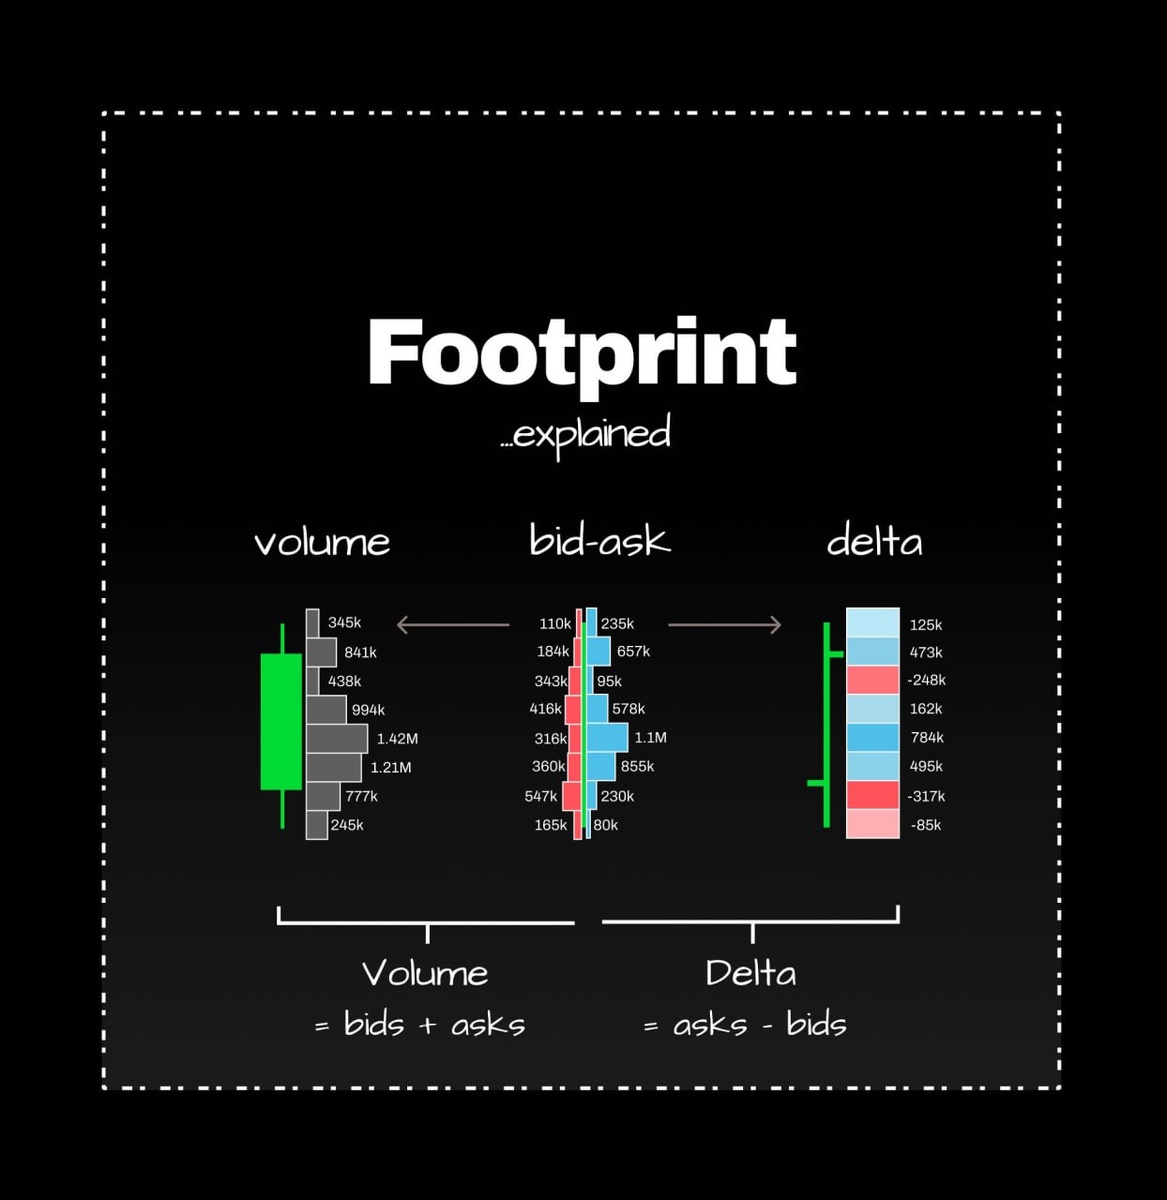
➡️ They display bid vs ask volume at each price level.
➡️ Check them out as volume clusters, profiles, or deltas.
➡️ Perfect for spotting absorptions, imbalances, and those sneaky trapped traders.
➡️ They unveil the true intent behind price moves—not just what happened!
Footprints show not just where the price went but how it got there! 🔍💥 #TradingInsights #MarketMoves