LED spectra
The LEDs produced today have a fairly narrow energy spectrum of radiation, which allows them to be attributed to the so-called spectral light sources. An ideal spectral light source (monochromatic) has an infinitely narrow spectrum.
The spectrum of the LED is primarily determined by the materials of the crystal. The most common compositions today are GaN and InGaN for the blue-green region of the spectrum and AlInGaP for the yellow-red. LED manufacturers provide generalized spectra of their products that do not allow for sufficiently accurate calculations. The results of the study of the spectra of LEDs from more than a dozen manufacturers allow us to draw the following conclusions:
The spectra of LEDs based on GaN and InGaN crystals have a characteristic spectrum width (at 0.5) of 25-30 nm for the blue region of the spectrum and 35-40 nm for the green.
The spectra of LEDs based on AlInGaP crystals have a characteristic spectrum width (at the level of 0.5) of 15-20 nm for the yellow-red region of the spectrum.
The spectra are asymmetric, and for GaN and InGaN crystals, the left branch is steeper than the right, and for AlInGaP crystals, on the contrary, the right branch is steeper than the left.
Knowledge of the spectra allows you to calculate the basic lighting parameters of LEDs and devices based on them, such as light efficiency, chromaticity coordinates, energy and light balance, etc.
Spectrum modeling
For calculations, it is convenient to use not a graphical, but a digital representation of the spectra. To do this, you need to use a spectrum model. Most natural processes have a normal distribution. The process of emitting LEDs is no exception. The shape of the spectra fits well enough into the Gaussian curve, which is described by the equation:
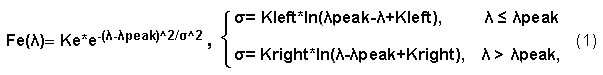
where λ is the current wavelength, λpeak is the peak wavelength, Ke, Kleft, Kright are coefficients.
For example, the figure shows (in the range of 400 - 700 nm) simulated spectra (thin color lines) superimposed on the spectra (thick black lines) given in the documentation for the full-color LED HSMF-C118 (Agilent). Spectrum diagrams are always normalized, that is, they are given in relative units, where Fe(λpeak)=1.
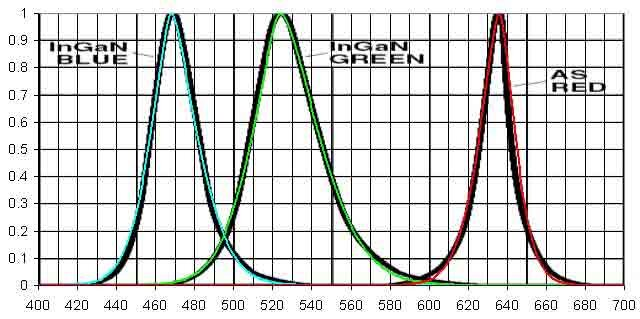
It can be seen from the figure that the proposed formula describes the real spectra of LEDs quite well. Further improvement of the equation does not make sense, since, firstly, the spectra given by the manufacturers themselves have certain errors and, secondly, this equation in this form is quite sufficient for calculations.