В этой статье мы детально рассмотрим IELTS Writings task 1:
структура задания, словарь, практика. Дочитайте до конца и попрактикуйтесь, чтобы точно усвоить новые знания.

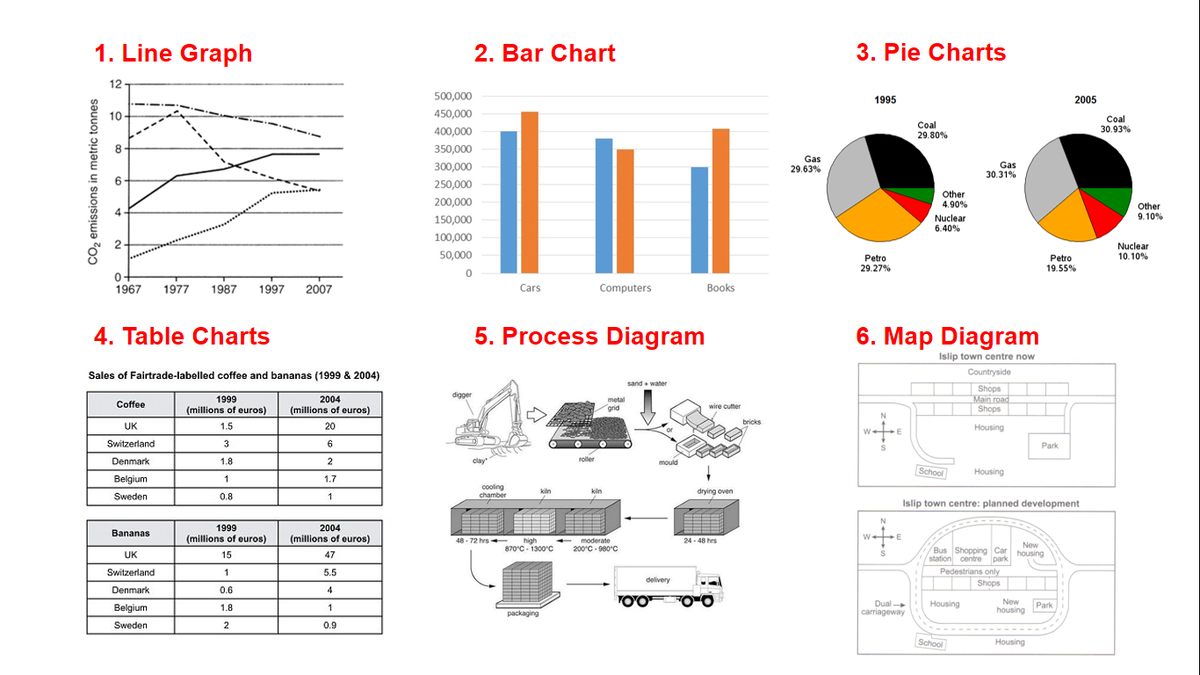
В первой части Academic Writing вам предстоит описать график, карту, таблицы. Так как писать нужно будет про статистику и изменения различных показателей, временные конструкции для этого задания:
Present Simple
Если статистика представлена в настоящем времени.
Past Simple
Если статистика представлена в прошедшем времени.
Времена Perfect
Если есть связь настоящего и прошедшего.
Структура письма
Paragraph 1: Introduction & Overview
Примерное количество слов: 50
Первое предложение (Introduction Sentence):
Опишите вид схемы/диаграммы, что она описывает и источник данных.
Не углубляйтесь в детали/цифры и не сравнивайте показатели.
«The pie chart is about the pets in Year 7. The chart is divided into 5 parts. It is taken from ...»
Второе предложение (Main Features):
Напишите пару предложений о данных в вашей таблице. Расскажите про самые высокие/низкие показатели или интересные моменты в статистике.
Не упоминайте причины высоких или низких показателей.
“The most interesting trend was ______________.”
“The biggest change over the given time period was ______________.”
Paragraph 2: Body Paragraph A
Примерное количество слов: 50
Выберите цифры/данные, которые выделяются и расскажите о них подробнее.
Опишите конкретные показатели. Здесь нужно будет скопировать информацию из вашей таблицы или схемы - это нормально.
Также в этой части можно сравнить наиболее отличающиеся/схожие показатели.
Paragraph 3: Body Paragraph B
Примерное количество слов: 50
Так же, как и в предыдущем абзаце - сравните/опишите наиболее важные моменты в статистике. Заключение в этом задании необязательно.
Полезные фразы для Academic Writing Part 1
Старт:
The/ the given / the supplied / the presented / the shown / the provided
Вид данных:
diagram / table / figure / illustration / graph / chart / flow chart / picture/ presentation/ pie chart / bar graph/ column graph / line graph / table data/ data / information / pictorial/ process diagram/ map/ pie chart and table/ bar graph and pie chart
Глагол:
shows / represents / depicts / enumerates / illustrates / presents/ gives / provides / delineates/ outlines/ describes / delineates/ expresses/ denotes/ compares/ shows contrast / indicates / figures / gives data on / gives information on/ presents information about/ shows data about/ demonstrates/ sketch out/ summarises
Описание:
the comparison of/ the differences…/the changes.../the number of…/information on…/data on…/the proportion of…/the amount of…/information on.../data about.../comparative data.../the trend of.../the/percentages of.../the ratio of.../how the...
Для обобщения:
1. In general...
2. In common...
3. Generally speaking...
4. Overall...
5. It is obvious...
6. As it is observed...
7. As a general trend...
8. As can be seen...
9. As an overall trend/ As overall trend...
10. As it is presented...
11. It can be clearly seen that...
12. At the first glance...
13. It is clear,
14. At the onset...
15. It is clear that...
16. A glance at the graph(s) reveals that...
Увеличение/Increase
rise / increase / go up / uplift / rocket(ed) / climb / upsurge / soar/ shot up/ improve/ jump/ leap/ move upward/ skyrocket/ soar/ surge.
Уменьшение/Decrease
a fall / a decrease / a reduction / a downward trends /a downward tendency / a decline/ a drop / a slide / a collapse / a downfall.
Без изменений/Steadiness
unchanged / level out / remain constant / remain steady / plateau / remain the same / remain stable / remain static
Постепенное повышение/Gradual increase
an upward trend / an upward tendency / a ceiling trend
Постепенное снижение/Gradual decrease
a downward trend / a downward tendency / a descending trend
Стабильность/Standability/ Flat
level(ed) off / remain(ed) constant / remain(ed) unchanged / remain(ed) stable / prevail(ed) consistency / plateaued / reach(ed) a plateau / stay(ed) uniform /immutable / level(ed) out/ stabilise/ remain(ed) the same.
No change, a flat, a plateau.
Практика
1. Заполните пропуски словами из списка:
horizontal/ vertical/ shows/ increase
The graph _______ the sales figures for two products from 1992 to 2002. The _______ axis represents years and the _______ axis represents units sold. The graph presents both the _______ and the _______ in sales for both products, as sales _______ during the ten-year period.
2. Поставьте T (True), если предложение верное и F (False), если предложение неверное:
- The graph shows annual sales of hardware and software over a period
- The horizontal axis on the graph shows the number of units sold.
- The vertical axis shows the number of units sold and is measured in numbers which go up by 5000 at each level.
- The graph only shows where sales have increased.
- It would be fair to say that sales figures have gone up and down over the period described.
IELTS Academic Writing Task 1 довольно простое задание, особенно, если вам попадется понятная схема.
Чтобы получить высокий балл по всем секциям, мало просто тренироваться и выполнять большое количество заданий.
Очень важно получать профессиональный фидбек. Так вы будете совершенствовать свои навыки и с бОльшей вероятностью получите желаемый балл.
В MasterIELTS ваши Writing и Speaking работы проверяют экс-экзаменаторы и сертифицированные IELTS-инструкторы.
Записывайтесь на бесплатный пробный урок, оценку уровня или консультацию!