
The RBNZ began its easing cycle in August, cutting rates by 25 basis points, followed by a more aggressive reduction of 50 basis points in October. With inflation currently within the central bank's target range of 1-3%, the RBNZ has shifted focus to stimulating the weakening economy. On November 27, the New Zealand regulator lowered interest rates by 50 basis points, from 4.75% to 4.25%, and indicated to participants that it is ready for further cuts in the first quarter of 2025, citing low economic activity and a decline in inflationary pressures.
It is worth noting that, according to the bank, inflation fell to 2.2% year-on-year in the third quarter of 2024, the lowest level in over three years. Thus, it can be considered that the return of inflation, as a result of restrictive monetary policy, has reached the target level.
Meanwhile, economic growth remains weak. A growth of 0.4% is expected in 2024, reflecting a decline in household spending and worsening labor market conditions. A continued cooling of the labor market is anticipated, with unemployment expected to rise at the beginning of 2025. All this fuels fears of stagnation or weak growth in tenths of a percentage point.
Therefore, a further rate cut for the NZD on February 19, 2025, seems quite realistic. Considering that the regulator makes decisions quarterly, it is logical to expect a reduction of 50 or even 75 basis points, to levels of 3.75% or 3.5%.
“If economic conditions continue to evolve as expected, the committee anticipates that it will be able to further lower the OCR at the beginning of next year,” the RBNZ stated.
The Bank of England also began to reduce rates in August, with a cut on August 1, 2024, from 5.25% to 5%. At the next meeting in September, the regulator took a pause, but on November 7, 2024, it cut rates again, by 25 bps to 4.75%. The next meeting of the Bank of England's Monetary Policy Committee is scheduled for December 19, 2024. The current inflation rate is 2.3%, against a target of 2%. Since May, inflation has hovered around 2.0%, dropping to a low of 1.7% in September. Thus, it can be said that the regulator has achieved its goal.
Now let’s look at the numbers characterizing the state of the economy. Regarding economic growth in England, we can refer to data from the Office for National Statistics (ONS): "Quarter-on-quarter growth of 0.1% in the third quarter (July to September) of 2024, following growth of 0.5% in the second quarter (April to June) and 0.7% in the first quarter (January to March) of 2024." The ONS also reported that "the monthly real GDP fell by 0.1% in September 2024, mainly due to a decrease in production in the manufacturing and information and communication services sectors." Allow me to remind you that this week, on Friday, December 13th, at 7:00 GMT, the ONS will publish a large block of macroeconomic indicators regarding GDP, industrial production, trade balance, and inflation expectations. This data will help us understand how likely a rate cut for the pound is at the next FOMC FRS meeting.
By the way, the release on December 13, during the pre-market of the London session, may provoke an increase in volatility and provide an opportunity for arbitrage trades using the HN strategy if the necessary technical model forms.
So, to summarize: the NZD rates are at 4.25%, with the next cut possible on February 19, 2025, while GBP rates are at 4.75%, with the next meeting on December 19, 2024. The difference is 0.5% in favor of GBP, but this could decrease on December 19 if the BoE cuts rates.
Now, let’s discuss the technical analysis of GBPNZD in the medium- and long-term outlook.
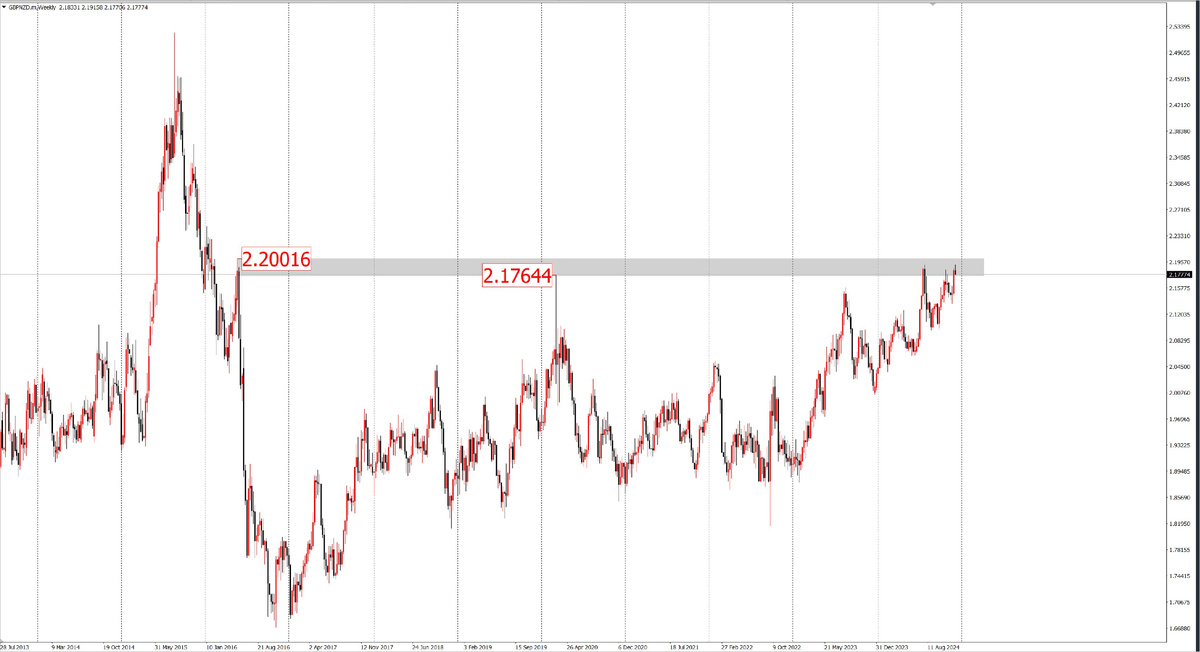
Weekly charts show that quotes have reached an eight-year resistance zone, which was tested in 2020, and last August, there was also an attempt to approach the resistance but pulled back into correction. Only in July of this year were last year’s highs surpassed, with GBPNZD entering the resistance zone (highlighted in gray on the weekly charts), but it could not break through. Once again, a correction occurred within the upward trend. In October, growth resumed, but the highs were not reached.
At the end of November and the beginning of December, the price approached the highs closely. As of today, December 9, during the Asian session, the 2024 high of 2.1907 was surpassed by a few points, with the maximum reaching 2.1916. Technical indicators on daily time frames reflect the state of a growing market, as expected. Neither the moving averages (EMA 100 and EMA 200) nor the ADX are showing reversal signals, which is understandable given that their signals typically lag.
However, with the beginning of the London session, we saw a deep and rapid pullback, and the European session, as we know, is characterized by high liquidity and volumes, making the movements generated during trading at this time more reliable than the overnight movements during the Pacific and Asian market sessions.
I propose considering two trading scenarios to plan for a medium-term trade.
The first scenario is for buying if the resistance zone is broken, with stop-loss trades set below the lows of November 27, 2024 (2.1360). It may also be worth considering moving stop-loss further down, below the 200-day EMA. Profit targets for such a trade could be calculated using Fibonacci-based instruments, for example, around 2.2800 – 2.2850. This does not exclude the application of trend-following strategies and profit locking upon the appearance of corresponding technical models or other signs of completion and reversal. The duration of such a trade could range from a few weeks to possibly months. Given that the rate difference is not significant, swap costs are also low. Profit potential starts from 8 figures (800 points) and above, while risk potential is from 6.5 figures and below.
The second trading scenario involves selling. In this scenario, the entry point is somewhat contentious and can be considered either based on today's closing, should the day end with a bearish candle, or on the opening of the London session tomorrow, again contingent on Monday closing as a bearish candle. It would be reasonable to expect a break below November's lows and to open sales below 2.1350, if confirmed by a closing price break at the end of the day. An entry based on an intraday “reversal” strategy with a view for a medium-term deal could also have been considered today.
In my view, one should take the news background into account. At the very least, analyze it and adjust decisions during trade management based on the results of the releases on Friday the 13th and Thursday of next week, December 19.
The risk limit for selling GBPNZD could be positioned above the recent highs, for instance, the current high of December 9, 2024, at 2.1916 (at the time of writing) or above the resistance zone on the weekly time frames—above 2.2000. As for profit targets, I would suggest looking at support zones, of which there are many awaiting GBPNZD in its downward movement, and not forgetting that this scenario trades on a rebound, moving against the trend of recent years, requiring readiness for the possibility that the downward trend turns into a correction, possibly sideways. Therefore, one should exercise extreme caution.
In this scenario, risk potential significantly depends on the entry level and can range from half a figure to 5.5 figures. The profit target size will also vary depending on the entry level and the exit strategy applied.
To avoid backlash, I would like to note that this article does not constitute trading advice; rather, it reflects solely my own thoughts and views. I encourage you to express your perspective in the comments if you have one. Please provide your arguments or present an alternative position, or perhaps suggest your approach to constructing a trading plan, trading signals. Ultimately, the final decision rests with each trader, taken at their own risk, and profits are accrued solely to their trading account.
Best regards.