In this case, values of the serum marker in women with BRCA mutations show decreased overlap between the healthy and diseased curves of women with BRCA mutations (curves on the top) compared with women without BRCA mutations (curves on the bottom). The corresponding decrease in the number of FPs and FNs means the new serum marker has higher sensitivity and specificity (ie, better performance) in women with BRCA mutations.
Q) A prospective study evaluates the relationship between regular antioxidant supplement use (vitamins C and E) and the risk of stroke in healthy and physically active men age 40-60. The study compares the risk of stroke among men who consumed antioxidant supplements for ≥5 years and among men who consumed antioxidant supplements for <5 years, as compared to a reference group of men who never consumed antioxidant supplements. According to the study results, men who consumed antioxidant supplements for <5 years and men who
consumed antioxidant supplements for ≥5 years have stroke relative risks of 0.95 (p =
0.45) and 0.75 (p < 0.01), respectively, when compared to the reference group. The results of the study were adjusted to account for baseline differences related to healthy behaviors and overall health. Which of the following factors most likely explains why the relative risk of stroke is lower with longer antioxidant use?
Ans) Antioxidant use for ≥5 years was associated with a statistically significant (p < 0.01) decreased risk of stroke (relative risk [RR] = 0.75 <1). By contrast, antioxidant use for <5 years demonstrated a nonstatistically significant (p > 0.05) smaller reduction in risk (RR = 0.95); in other words, antioxidant use for <5 years seems to have no benefit on stroke risk reduction. This discrepancy can be explained if reduction in stroke risk is associated with
the duration of exposure to antioxidant supplementation; in other words, a minimum cumulative exposure to antioxidants may be necessary for the exposure to have a significant effect on stroke risk.
This concept of accumulation effect can apply to both risk factors and risk reducers. The effect of exposure to risk factors may depend on the duration and intensity of the exposure; long-term exposure may be necessary well before an effect on the disease process is clinically evident (eg, lung cancer developing after decades of smoking exposure). Similarly, exposure to certain risk reducers must occur continuously over extended periods before disease outcome is affected. In this case, ≥5 years of continuous antioxidant use (risk reducer) were required to reveal their protective effect on stroke.
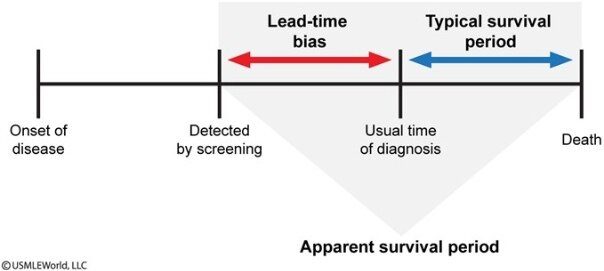
(Choice B) Lead time is the time between the initial detection of a disease and a specific outcome or measured endpoint. Lead-time bias can occur when a test detects or diagnoses the disease at an earlier stage than another test without impacting the natural history of the disease. A study comparing disease survival times may then erroneously conclude that using the earlier-detection test prolongs survival, when in actuality the increased survival time is due solely to earlier detection of the disease.
(Choice C) Observer bias occurs when an observer misclassifies data due to individual differences in interpretation or preconceived expectations regarding a study. It can be reduced by performing a double-blind study (ie, both observers and participants unaware of randomized parameters) and by having multiple observers encode and verify the recorded data.
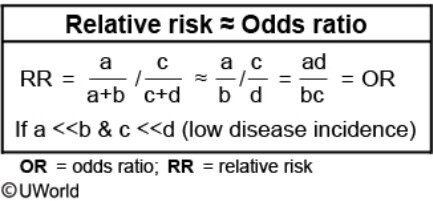
(Choice D) Diseases with a very low incidence rate in the population will also have a very low prevalence. According to the rare disease assumption, the odds ratio approximates RR when disease prevalence is low (eg, <10%).
(Choice E) Selection bias can occur with inappropriate (ie, nonrandom) selection methods or through selective attrition of the study participants. Although selection bias is a possible limitation of the study (eg, individuals who take vitamins daily may be more likely to be already healthy), the fact that the study was limited to healthy, physically active men and that it adjusted for baseline differences should considerably reduce the effect of this potential bias.
Blinding
Blinding technique is commonly used in clinical trials. The blinding can involve patients exclusively or both patients and physicians (double blinding). The main purpose of blinding is to prevent patient or researcher expectancy from interfering with the determination of an
outcome. For example, a researcher's belief in a positive outcome in treated patients can potentially result in observer bias.
(Choice A) Beta error refers to a conclusion that there is no difference between the groups studied when a difference truly exists. Beta error is a random error, not a systematic error (i.e., bias).
(Choice B) Recall bias results from the inaccurate recall of past exposure by subjects. It applies mostly to case-control studies.
(Choice D) Effect modification is not a bias and should not be controlled.
(Choice E) Selection bias results from the manner in which people are selected for the study, or from the selective losses from follow-up.
Cohort study
A cohort study is an observational design in which potential participants in the population of interest are initially identified as exposed or nonexposed according to the independent variable (ie, exposure status to a risk factor). Once participants are categorized based on their exposure status, the occurrence (ie, incidence) of the dependent variable (eg, outcome of interest) over a specific period is determined in each group. Finally, the occurrence of the outcome is compared between exposed and nonexposed groups to estimate the association between the risk factors and the outcomes. If there is a statistically significant difference in outcome occurrence between the 2 groups, it is likely that the risk factor in question is associated with disease development.
In this example:
- The population of interest is patients with type 2 diabetes
mellitus (T2DM). Therefore, both the exposed and nonexposed groups must consist of patients with T2DM (Choices D and E).
- The risk factor of interest is morbid obesity (BMI >40 kg/m2). Therefore, the exposed group is adults with morbid obesity, and the nonexposed group is adults with normal weight (BMI 18.5 to <25 kg/m2) (Choice A).
- The outcome of interest is diabetic nephropathy. Exposed and nonexposed subjects must be selected with no history of the outcome because the occurrence of the outcome is what is measured during the study period (Choice B).
Therefore, the exposed group is adults with T2DM who have morbid obesity and no diabetic nephropathy; the nonexposed group is adults with T2DM who have normal weight (BMI 18.5 to <25 kg/m2) and no diabetic nephropathy. Comparing the frequency of the outcome (eg, diabetic nephropathy) between exposed and nonexposed groups is what determines whether exposure to the risk factor (eg, morbid obesity) is associated with the risk of developing the outcome (eg, diabetic nephropathy).
A randomized controlled trial is conducted to compare transcatheter aortic valve replacement (TAVR), using a self-expanding transcatheter aortic valve bioprosthesis, with surgical aortic valve replacement in patients with severe aortic stenosis. The objective is to determine the difference in risk of death from any cause. Seven hundred forty-seven patients with severe aortic stenosis who are at increased surgical risk are recruited and randomly assigned to groups for treatment with TAVR or surgical valve replacement. Follow-up assessments are performed at discharge and at 1 month, 6 months, and 1 year. The 1-year follow-up results are as follows:
Which of the following best represents the absolute risk reduction for death from any cause in patients treated with TAVR compared to those treated with surgical replacement?
Ans
Absolute risk reduction (ARR) describes the difference in risk of an unfavorable outcome between the treatment group (eg, new treatment) and the control group (eg, standard treatment):
ARR = (Riskcontrol − Risktreatment)
In this example, Riskcontrol is the risk of death from any cause in the group treated with surgical aortic valve replacement and is determined by dividing the number of deaths in that group (68) by the total number of patients in that group (357). Risktreatment is the risk of death from any cause in the group treated with transcatheter aortic valve replacement (TAVR) and is determined by
dividing 57 by 390. Therefore, the ARR for death from any cause in patients treated with TAVR compared to those treated with surgical replacement is calculated as follows:
ARR = (68/357) − (57/390) = 0.044
ARR can be used to determine the number needed to treat (NNT), calculated as: NNT = 1 / ARR
NNT is the number of patients who need to be treated with a treatment (eg, TAVR) to prevent 1 additional negative event (eg, death from any cause) when compared to a control group (eg, surgical replacement). A lower NNT indicates a more effective treatment because fewer patients need to be treated to prevent 1 additional negative outcome. In this example, the approximate NNT with TAVR to prevent 1 additional death from any cause is:
NNT = 1 / [(68/357) − (57/390)] = 22.562 (Choice E)
(Choice B) [(68/357) − (57/390)] / (68/357) = 0.233 represents the relative risk reduction (RRR)
for death from any cause in the TAVR group compared to the surgical replacement group: RRR
= (Riskcontrol − Risktreatment) / Riskcontrol. Unlike ARR, which quantifies the absolute difference in risk between the groups, RRR describes the difference in risk between the groups as a proportion of baseline risk (ie, risk in the control group).
(Choices C and D) Switching the numerator and denominator changes the interpretation of the relative risk (RR, the ratio of the probability of an event occuring in one group compared to the other group). In this example, (57/390) / (68/357) represents the RR of death from any cause in the TAVR group compared to the surgical replacement group; (68/357) / (57/390) represents the RR of death from any cause in the surgical replacement group compared to the TAVR group.
A meta-analysis groups the results of several trials (ideally, high-quality randomized controlled trials) to increase statistical power and provide an overall estimate of the effect of an exposure (eg, cocoa intake) on an outcome (eg, systolic blood pressure [SBP]). The individual results of the trials are assessed and weighted to obtain a pooled effect estimate. In this example, the meta-analysis showed an overall change in mean SBP of −2.2 mm Hg (ie, decrease in SBP) in the cocoa intake group compared to the control group. The 95% confidence interval (CI) was
−2.7 to −1.3 mm Hg, indicating a statistically significant difference because the CI does not include the null value (explained below).
CIs give a range of plausible values for an unknown parameter (eg, difference between 2 mean SBPs) based on results from a sample. If the CI does not include the null value, then the result is statistically significant; if it crosses the null value, then the result is not statistically significant. All CIs have a null value, but the null value is not the same for all CIs. For an odds ratio or a relative risk (RR), the null value is 1 because these statistics are ratios (ie, RR = 1 represents no difference in risk between the groups). However, if the parameter of interest is
a difference (eg, difference in mean SBP between cocoa intake and control groups), then the null value is 0 because that represents no difference between the groups.
In this case, the 95% CI of [−2.7, −1.3] does not include the null value of 0 and therefore the result is statistically significant. In summary, cocoa intake was associated with a statistically significant decrease in SBP.
(Choices A and E) The overall mean change in SBP was negative at −2.2 mm Hg, reflecting a lower SBP in the cocoa group compared to the control group. The change was statistically significant.
(Choice B) Although there was a statistically significant decrease in SBP in the cocoa intake group, the clinical significance may be limited as the absolute SBP decrease is only about 2 mm Hg. Furthermore, the trials measured SBP at 2 weeks, so it is possible that the effect of cocoa intake on SBP was short-lived. Finally, no information is provided regarding adverse effects of cocoa intake.
(Choice D) Given that the CI crossed the null value in studies 2 and 7, there was no statistically significant difference between the groups in these studies.
A population pyramid displays the percentage of individuals in each age cohort to describe the current population profile, and to project how the population will increase/decrease in the
future. Every population pyramid is unique, but most fit into one of three general categories.
- Expansive populations have high birth and mortality rates and short life expectancies. Therefore, they show a larger percentage of people in younger cohorts (ie, graph has a broad bottom and narrow top). These populations are young and growing, and their pyramids characterize many developing countries.
- Stationary populations have declining birth rates, low mortality rates, and long life expectancies. Therefore, they show a somewhat equal percentage of people in each age cohort (ie, graph has a somewhat rectangular shape). These populations
are stable (ie, neither growing nor shrinking), and their pyramids are characteristic of many developed countries.
- Constrictive populations have significantly low birth and mortality rates, and long life expectancies. Therefore, they show a smaller percentage of people in younger
cohorts (ie, graph has a narrower bottom). These populations are shrinking, and their pyramids are characteristic of very advanced countries with a high level of literacy, easy access to birth control measures, and exceptional health and medical resources.
In this question, the population pyramid has a broad bottom, indicating a high birth rate, and a narrow top, indicating a higher mortality rate that results in a short life expectancy (Choices B and C). Populations with high birth rates are populations that are young and growing (Choices D and E). Therefore, the population pyramid is characteristic of many developing countries.
A study is designed to evaluate the efficacy of a new drug, KM28. The study will compare KM28 plus standard care versus standard care alone with regard to decreasing the incidence of recurrent breast cancer. The Food and Drug Administration (FDA) will approve the new drug if KM28 plus standard care decreases the rate of breast cancer recurrence by at least 40% compared to standard therapy alone. The recurrence rate on standard therapy is found to be 8%. In order for the FDA to approve KM28, what is the maximal incidence of recurrent disease acceptable for women treated with KM28 plus standard therapy?
The new drug, KM28, will be approved if its associated recurrence rate is decreased by at least 40% compared to the recurrence rate on standard therapy alone, which is given as 8%. As 40% of 8% is 0.40 × 8% = 3.2%, the maximum acceptable recurrence rate is 8% − 3.2% = 4.8%. Another quick solution would be to state that the maximum acceptable recurrence rate is 60% of 8%, which is 0.60 × 8% = 4.8%.
An alternate solution involves using relative and absolute risk calculations. The 40% (ie, 0.4) mentioned in the prompt refers to relative risk reduction (RRR), defined as the percent reduction in absolute risk (AR) between the treatment group (eg, KM28 + standard therapy) and the control group (eg, standard therapy). The formula for RRR is:
RRR = (ARcontrol − ARtreatment) / ARcontrol
In this example, ARcontrol, which represents the risk of recurrence with standard therapy, is given as 8% or 0.08. The formula can be rearranged to calculate ARtreatment:
ARtreatment = ARcontrol – (RRR × ARcontrol)
Plugging in the values for RRR and ARcontrol gives:
ARtreatment = 0.08 – (0.4 × 0.08) = 0.08 – 0.032 = 0.048 (ie, 4.8%)
RRR may overstate the effectiveness of an intervention. For example, a RRR of 50% occurs whether a drug decreases the incidence of a disease from 2% to 1% or from 50% to
25%. Clearly, the latter is of greater clinical significance.
A new biomarker has been identified that allows for the early detection of invasive gastric carcinoma. It has a sensitivity of 89% and a specificity of 85% when compared to endoscopy with multiple biopsies. The test is used in 2 groups: a population in the United States, where 5 out of 100,000 people have gastric cancer, and a population in China, where 100 out of 100,000 people have been diagnosed with the disease. Which of the following is the most accurate statement concerning this new test?
The positive predictive value (PPV) is defined as the proportion of individuals with positive test results who actually have the disease. This concept can be understood in terms of probability: given that a patient has a positive test result, what is the likelihood that he or she actually has the disease? PPV depends not only on the sensitivity and specificity of a test, but also on the prevalence of the disease in the population being tested. The more common the disease in the population, the more likely it is that a patient with a positive test result actually has the disease.
If the disease is relatively common (eg, gastric cancer in China), there is a higher probability that a patient who tests positive actually has the disease (ie, more likely to be a true positive). However, if the disease is relatively uncommon (eg, gastric cancer in the United
States), a patient who tests positive will have a lower probability of actually having the disease (ie, more likely to be a false positive).
(Choice A) Like PPV, the negative predictive value (NPV) depends on disease
prevalence. However, NPV is inversely associated with the prevalence: NPV increases as the disease prevalence decreases. This is because the probability of a true negative result is higher in a population with low disease prevalence (eg, gastric cancer in the United States).
(Choices C and D) Sensitivity and specificity are intrinsic test parameters that do not depend on the prevalence of disease in the tested population
(Choice E) Reliability is a measure of the consistency (reproducibility) of a diagnostic test result (ie, if the test is taken multiple times, will the results be the same?). No information is provided to suggest that the gastric cancer biomarker is unreliable.