Время от времени мне приходится извлекать научные данные из графиков. В https://pantelisliolios.com/digitize-scientific-plots-python/ представлено решение данной проблемы с помощью Python, однако данное решение пришлось доработать. Получились следующие выражения.
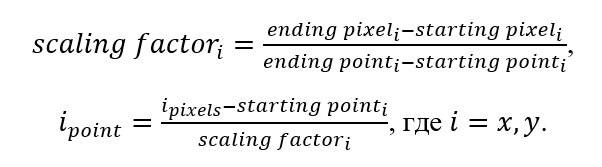
Данные выражения представляют собой переход из системы координат пикселей в систему координат наших данных. Это самое простое решение нашей задачи.
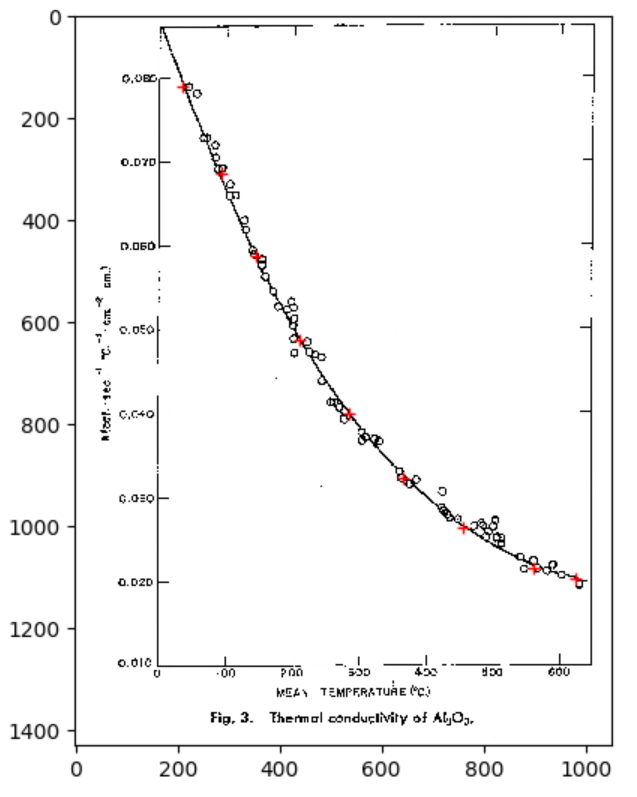
Поскольку я мало знакома с Python, мне потребовалось время, чтобы хотя бы немного разобраться в исходной программе и немного переделать её. На рисунке 2 представлен пример график, с которого нужно считать данные.
Ниже представлен код, переделанный в соответствии с выражениями на рисунке 1.
from tkinter import Tk, filedialog, messagebox, simpledialog
from numpy import asarray, savetxt
import matplotlib.pyplot as plt
import matplotlib.image as mpimg
root = Tk() # open the dialog box
root.withdraw() # first hide the root window
# open the dialog
filein = filedialog.askopenfilename(
title = "Select image to digitize",
filetypes = (
("png files","*.png"),
("jpeg files","*.jpg"))
)
# show the image
img = mpimg.imread(filein)
_, ax = plt.subplots()
ax.imshow(img)
# ax.axis('off') # clear x-axis and y-axis
# get reference length in x direction
def getReferenceLength(index):
direction = 'x' if index == 0 else 'y'
reply = False
while not reply:
reply = False
validLength = False
while not validLength:
messagebox.showinfo("Select the START of {:s} direction".format(direction),
"Click the START of {:s}.".format(direction))
coord1 = plt.ginput(1,timeout=0,show_clicks=True) # (число точек, ?, показать точки)
data1 = simpledialog.askfloat("Enter MIN","Enter the MINIMUM in {:s} direction".format(direction))
if isinstance(data1, float):
validLength = True
else:
messagebox.showerror("Error","Please provide a valid MIN.")
messagebox.showinfo("Select the END of {:s} direction".format(direction),
"Click the END of {:s}.".format(direction))
coord2 = plt.ginput(1,timeout=0,show_clicks=True)
data2 = simpledialog.askfloat("Enter MAX","Enter the MAXIMUM in {:s} direction".format(direction))
if isinstance(data2, float):
validLength = True
else:
messagebox.showerror("Error","Please provide a valid MAX.")
# factor=data1 data2 coord1 coord2# то, что нужно для расчётов и то, что функция возвращает
reply = messagebox.askyesno("Information",
"You selected from {:4.4f} to {:4.4f} in {:s}. Is this correct?".format(data1,data2,direction)
)
PiForPo=(coord2[0][index]-coord1[0][index])/(data2-data1)
return [PiForPo,data1,coord1]
xfactor = getReferenceLength(0)
yfactor = getReferenceLength(1)
# digitize curves until stoped by the user
messagebox.showinfo("Digitize curve",
"Please digitize the curve. The first point is the origin." +
"Left click: select point; Right click: undo; Middle click: finish"
)
# get the curve points
data = plt.ginput(-1,timeout=0,show_clicks=True)
data = asarray(data)
ax.plot(data[:,0],data[:,1],'g','linewidth',1.5)
plt.draw()
# convert the curve points from pixels to coordinates
xPiForPo=xfactor[0]
xdata=xfactor[1]
xcoord=xfactor[2]
data[:,0] = xdata + (data[:,0]-xcoord[0][0])/xPiForPo
yPiForPo=yfactor[0]
ydata=yfactor[1]
ycoord=yfactor[2]
data[:,1] = ydata + (data[:,1]-ycoord[0][1])/yPiForPo
# write the data to a file
# first get the filename
validFile = False
while not validFile:
fileout = filedialog.asksaveasfilename(
title = "Select file to save the data",
filetypes = [ ("Simple text files (.txt)", "*.txt") ],
defaultextension = 'txt'
)
if len(fileout) == 0:
# nothing selected, pop up message to retry
messagebox.showinfo("Filename error", "Please select a filename to save the data.")
else:
validFile = True
# write the data to file
savetxt(fileout, data, delimiter='\t')
plt.clf() # clear the figure
Полученные в виде таблицы данные и есть точки, отмеченные на картинке.