Before you start, make sure prometheus is set to true in .gaia/config/config.toml.
Manual Installation
1. Install Grafana
- Navigate to your working directory of choice
For demonstration purposes, this tutorial will assume an amd64-based device running Linux is used.
$ wget https://dl.grafana.com/oss/release/grafana_5.4.2_amd64.deb
$ sudo apt-get install -y adduser libfontconfig
$ sudo dpkg -i grafana_5.4.2_arm64.deb
2. Start Grafana Server As a Service
Choose either one of the approaches down below:
Option 1: via systemd
$ systemctl daemon-reload
$ systemctl start grafana-server
$ systemctl status grafana-server
Optionally, you may make grafana-server start at boot
$ sudo systemctl enable grafana-server.service
Option 2: init.d service
$ sudo service grafana-server start
Optionally, you may make grafana-server start at boot
$ sudo update-rc.d grafana-server defaults
3. Download Prometheus
- Navigate to your working directory of choice
$ wget https://github.com/prometheus/prometheus/releases/download/v2.6.0/prometheus-2.6.0.linux-amd64.tar.gz
- Extract the tar.gz file
$ tar xvfz prometheus-2.6.0.linux-amd64.tar.gz
- cd into the folder containing the extracted files
$ cd prometheus-2.6.0.linux-amd64
4. Configure Prometheus
- Add the following in prometheus.yaml using your editor of choice
# "yore node name" monitoring
- job_name: 'Validator'
static_configs:
- targets: ['localhost:26660']
labels:
group: 'Validator'
Feel free to change job_name and group to whatever you like. You can verify if your finished prometheus.yaml is valid using YAMLLint.
5. Start Prometheus
While still in the folder where the extracted files are located, run
$ ./prometheus --config.file=prometheus.yml
Prometheus is now running. We will then need to configure a dashboard on Grafana.
6. Add a Data Source
- Log in on Grafana.com with your registered account (register if you haven’t) by hitting the Log In button on the top right corner

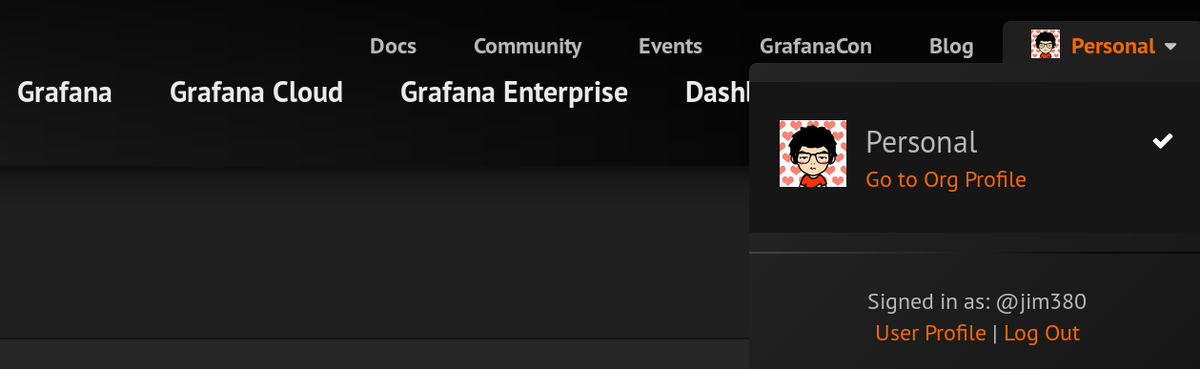
- Once logged in, go to your Org Profile page and create a Grafana instance
- Log in to the instance you just created, and start adding a data source by clicking on the gear button at the bottom of the column on the left. Then click on Add data source
On the settings page make sure your settings match, or are at least close to what’s shown below:
- Hit “Save & Test” to finish adding the data source
7. Build a Dashboard
You are welcome to make your own dashboard. For your convenience, we have one ready for you in this tutorial. Simply follow the steps below to import it:
- Start importing by clicking on the + button at the top of the column on the left. Paste in the JSON wits dashboard setting and load it
- Go to the Dashboards page by hitting the button below the + button. And Voilà ! You now have a working dashboard
Bonus: Node Exporter
Download the latest Prometheus Node Exporter static binary from here, and extract it:
$ wget https://github.com/prometheus/node_exporter/releases/download/v*/node_exporter-*.*-amd64.tar.gz
$ tar xvfz node_exporter-*.*-amd64.tar.gz
Change working directory to where you extracted the binary to, then run the node exporter:
$ cd node_exporter-*.*-amd64
$ ./node_exporter
Add the following in prometheus.yaml using your editor of choice.
# node exporter
scrape_configs:
- job_name: 'node'
static_configs:
- targets: ['localhost:9100']
#nft #node #ноды #testnet #тестнеты #аирдропы