EEG trends
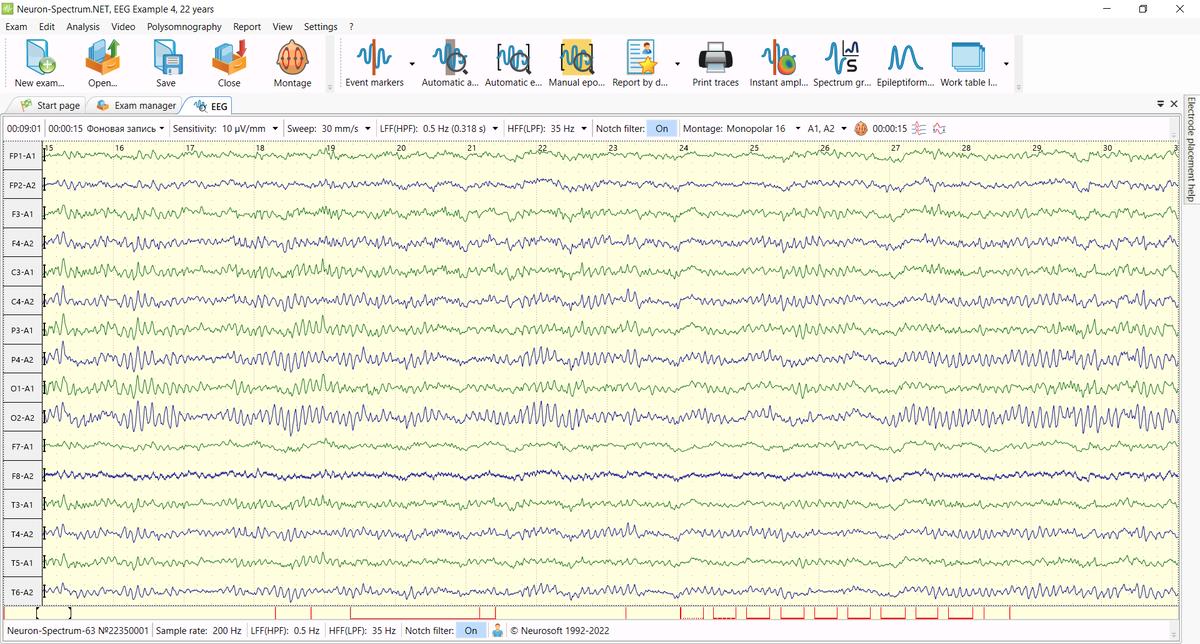
When analyzing short EEG examinations, it is quite easy to view all the traces and analyze them. However, during long examinations, viewing and analyzing native EEG traces can take quite a long time. EEG trends are used to quickly view the quantitative indicators of a long-term EEG recording. Trends are the results of calculating a certain parameter, presented over time over a fairly long period. It is so called Quantitative EEG (qEEG).
For example, wave rhythm index trends reflect the change in the frequency composition of a signal over time. Each trend displays its rhythm index. The rhythm index is calculated as the ratio of the area under the spectrum graph in the frequency range of this rhythm to the total area under the spectrum graph in the entire range of wave rhythms. Rhythm index is displayed as a percentage. The information panel displays wave rhythm indices for the current trend position.
The trend of the average EEG amplitude displays the calculated average amplitude of the EEG waves for the given derivations (by default, all visible derivations of the montage). This trend is also called the "envelope". The information panel shows the current average amplitude of EEG waves at a given time. Using the controls, you can change the scale of the trend, as well as set the level of amplitude values at which they will be highlighted in red.
Specialized programs have been developed for calculating and displaying trends in various EEG parameters:
When using the EEG in intensive care units to assess the functional state of the CNS, the amplitude-integrated EEG trend is often used:
Trends in Neuron-Spectrum.NET Software
In Neuron-Spectrum.NET Software there are lots of different trends. Now let's see how it works.
DSA — Density Spectral Array or CSA – Continuous Spectral Array)
This trend in compressed form represents the amplitude of the power spectrum at each point in time. The frequency of the spectrum is plotted along the y-axis, and the ranges of wave rhythms (delta, theta, alpha, beta LF and beta HF) are highlighted. The spectrum power amplitude is displayed on this two-dimensional field as a point of a certain color, which is set by the scale (from blue to red through green). The color scale can be adjusted to the right of the trend graph. The information panel displays the frequency composition of the signal at the current time. Using this trend, it is easy to track at what time the signals of what frequencies dominated the recording.
Dominant frequency
The dominant frequency is the frequency at which the spectrum power graph has the maximum amplitude. This is the frequency that is most represented in the signal:
Spectral edge
The spectral edge is such a frequency, to the left of which 95% of the total power of the spectrum is located. The remaining 5% are considered insignificant:
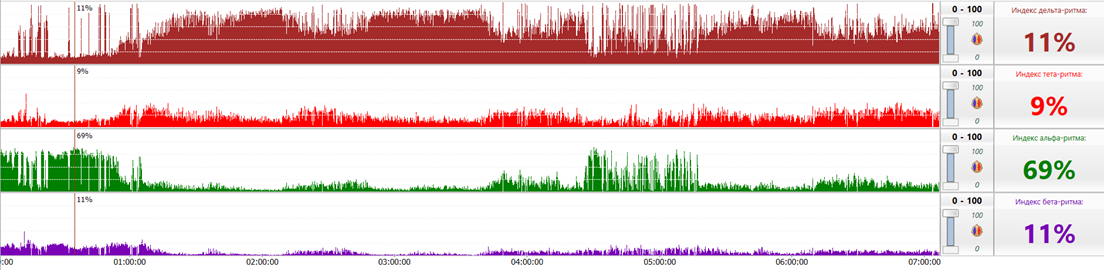
Rhythm index trend (delta, theta, alpha, beta)
Trends of wave rhythm indices reflect the change in the frequency composition of the signal over time. Each trend displays its rhythm index. The rhythm index is calculated as the ratio of the area under the spectrum graph in the frequency range of this rhythm to the total area under the spectrum graph in the total range of wave rhythms. Rhythm index is displayed as a percentage. The information panel displays wave rhythm indices for the current trend position.
Wave Rhythm Index Ratio Trend
A set of such trends shows how the ratio of wave rhythm indices changes over time. For example, in the figure below, the upper trend shows how the alpha rhythm index relates to the delta rhythm index. It is clearly seen that in the first hour of recording, the alpha rhythm prevailed over the delta rhythm by more than five times, but then the situation changed dramatically.
All these 5 trends can be replaced by only one, which presents the relative index of all rhythms at once using color. The color for each rhythm is set in the program settings. The greater the width of a certain color at each moment of time, the greater the index of the corresponding rhythm in relation to other rhythms. So, for example, in the first hour of the recording, the alpha rhythm dominates, which corresponds to the green color. Then the delta rhythm (brown) begins to occupy the main part of the spectrum. Theta (red) and beta (blue) rhythms maintain approximately the same index throughout the recording. The information panel (on the right) displays a diagram of the ratio of wave rhythm indices at the current time.
The following image shows a trend in the ratio of wave rhythm indices, where the alpha rhythm (green) dominates during the first hour of recording, and then the delta rhythm (brown) begins to predominate. Under the trend, the corresponding spectrum graphs are shown, clearly demonstrating the frequency composition of the signal in these areas of the record:
Here is another example of working with this type of trend: the trend of the ratio of wave rhythm indices calculated for EEG derivations of the left hemisphere is shown at the top, and for the right hemisphere at the bottom. It is clearly seen that more slow-wave activity is recorded over the left hemisphere than over the right. This slowdown is indicative of a left hemisphere lesion in this patient.
Average EEG amplitude (envelope)
The trend of the average EEG amplitude displays the calculated average amplitude of the EEG waves for the given leads (by default, all visible derivations of the montage). This trend is also sometimes referred to as an "envelope". The information panel shows the current average amplitude of EEG waves at a given time. Using the controls, you can change the scale of the trend, as well as set the level of amplitude values at which they will be highlighted in red.
In the mode of displaying interhemispheric asymmetry on the trend, you can see at what time points over which hemisphere the average EEG amplitude is greater, and over which it is less. The blue color indicates the areas of the recording in which the average EEG amplitude over the left hemisphere exceeds the amplitude over the right hemisphere. Red is the opposite. The information panel (on the right) additionally displays the percentage of amplitude asymmetry.
Maximum EEG amplitude
The maximum EEG amplitude trend is very similar to the previous one, but instead of the average amplitude, it displays the maximum EEG amplitude for given derivations (by default, all visible montage derivations). It also provides for setting the amplitude level, above which the values will be highlighted in red, as well as the mode for displaying interhemispheric asymmetry.
Number of spikes and sharp waves trend
This trend displays the number of spikes and sharp waves on the EEG. The information panel on the right shows the number of spikes and sharp waves in the current epoch. The epoch duration is determined by the amount of time displayed on the trend and corresponds to one pixel at the current monitor resolution. That is, if the trend shows 10 hours of recording and the width of the trend on the screen is 1000 pixels, then the duration of the epoch for calculation will be 36 seconds (36000 sec / 1000 pixels).
Total spectral power trend
This trend displays the change in total spectral power over time over the total frequency range corresponding to wave rhythms (by default: 0.5-35 Hz). The apparent spectral power is calculated as the area under the power spectrum graph in a given frequency range.
When comparing the trend of the total spectral power with the trend of the average EEG amplitude, it is easy to see their correlation. In fact, both of these trends display approximately the same information, namely, the total power of the recorded EEG signal. The higher the amplitude of the waves, the greater the value on these trends.
Amplitude-integrated EEG (aEEG)
This trend was first proposed by P.F. Prior in 1971. When calculating it, native EEG curves are filtered in the range of 2-15 Hz, their amplitude is averaged over 10-second sections. The resulting trend plot is displayed on a 6 cm/hour time scale with a semi-logarithmic scale along the y-axis. From 0 to 5 μV the scale is linear, from 5 to 100 - logarithmic. This representation makes it possible to examine low-amplitude sections in more detail and, at the same time, to see rather high-amplitude fragments of the record.
Nowadays aEEG trend is widely used in EEG in Intensive Care Units (ICU).
When calculating the trend on the graph in each epoch, the minimum and maximum EEG amplitudes recorded in this epoch are plotted.
The current aEEG pattern depends on these two values.
Atlases on the amplitude-integrated EEG have been published, which consider all possible patterns of this trend, their interpretation and influence on the prognosis of the CNS state.
Anesthesia Depth Index Trend (NINDEX)
When the Neuron-Spectrum.NET program works together with the NINDEX program, a trend of the anesthesia depth index can be calculated using one EEG channel, showing the degree of consciousness of the patient over time.
Spectral entropy trend
This trend reflects the change in spectral entropy (the first derivative of the total spectral power) over time and is used to assess the level of consciousness or the depth of anesthesia.
Burst-Suppression trends
This set of trends reflects the number of Burst episodes per minute and per hour, the interval between Bursts (sec), and the percentage of Suppression episodes compared to Burst episodes. Such trends are often used in neonatology to evaluate the Burst-Suppression aEEG pattern.
Impedance
This trend displays changes in electrode impedance for all electrodes during the entire recording and allows you to correct electrode overlap in a timely manner.
In conjunction with other trends, it helps to understand in which areas of the recording the recording quality could not be the best and artifacts are possible.
Success trend of biofeedback training (BFB)
This trend reflects the success of the tasks of biofeedback training for examinations with the implementation of this technique. Used to track the dynamics of training success.
PSG trends
In addition to EEG trends, which are calculated from various parameters of EEG traces, the Neuron-Spectrum.NET program can also calculate PSG trends based on various parameters of polysomnographic traces.
List of PSG trends
- Blood oxygen saturation (SpO2) trend.
- Respiratory rate trend.
- Trend of movement of the abdominal wall (Abdominal).
- Chest movement trend (Thorax).
- Heart rate (HR) trend.
- limb movement trend.
- Snoring trend.
- Body position trend.
- Eye movement trend.
- EMG amplitude trend.
- CPAP pressure trend.
- EtCO2 level trend.
- Pulse wave propagation velocity trend (PTT - Pulse Transition Time).
- Light level trend.
- Body temperature trend.
- Blood pressure trend.
- Movement activity trend.
- Perfusion index trend.
- PSG episodes.
Immediately below the hypnogram, there is a trend in SpO2 saturation level, then a trend in respiratory rate, trends in the amplitude of movement of the chest and abdominal wall, and a trend in heart rate. Based on these trends, it is easy to draw a conclusion about the patient's breathing during sleep and about the work of his cardiovascular system.
Video recording with a lecture on trends:
Conclusions
- Thus, using such a powerful analysis tool as Trends, you can quickly analyze large amounts of data without having to look at native traces for a long time.
- This tool saves a lot of time when analyzing long examinations.
- Comparing different trends on the computer screen, you can identify patterns and mutual influence of parameters on each other, compare parameters by hemispheres or selected derivations.
- In addition, with the help of trends, you can quickly assess the dynamics of the patient's condition.