Ishikawa diagram is a tool for visualizing the cause-and-effect relationships of a specific situation or problem in order to detect the root cause. The diagram helps to determine the main factors that have the most significant impact on the development of the analyzed event, as well as to prevent or eliminate the action of these factors. Ishikawa diagram was developed by a Japanese specialist Kaoru Ishikawa and was initially used in quality management processes in production. This technique, due to its similarity to the fish skeleton, has other names such as Fishbone diagram, Herringbone diagrams, or Fishikawa.
This template helps you not to miss significant problems and look at the current situation from different sides.
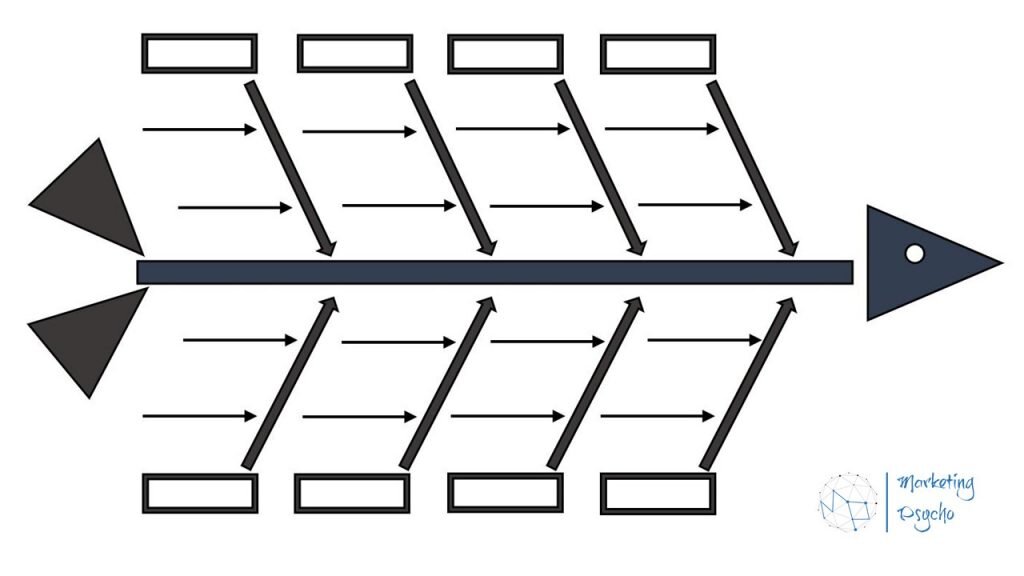
The fish’s head and backbone are the key problems that need to be solved. Lateral big arrows (or big fishbones) that are directed to the backbone are the main reasons that could lead to the key problem. Horizontal small arrows (or small fishbones) that are directed to big fishbones are the reasons that explain why complications occurred in these blocks. Even smaller arrows can be attached to small fishbones, so until all the details that affect the key problem are revealed.
To build Ishikawa diagram, it is necessary to assemble a team of specialists, as well as appoint a moderator to coordinate the action. Based on the structure of the skeleton, we can conditionally divide the process of building the Ishikawa diagram into several stages.
Backbone
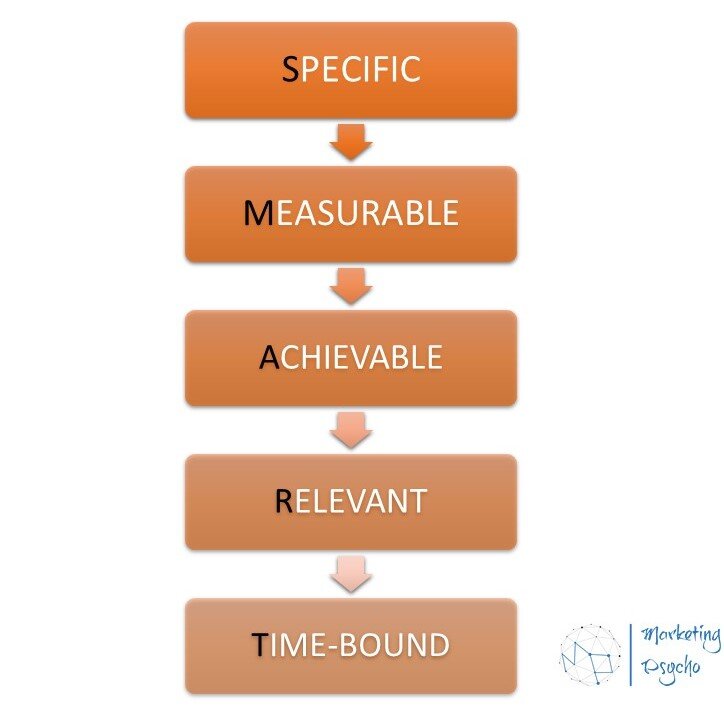
Here we describe the problem situation. To more accurately determine the problem, you can use the SMART method.
Big Fishbones
Team members need to identify several blocks that can affect the key problem, based on the specifics of your enterprise, for example, the environment, people, management, equipment, and others. These are not the root causes, but their symptoms.
Small Fishbones
For each block, we find several reasons that show why they do not work. If these reasons are not enough, then we look further, moving on to smaller fishbones. In this case, the 5 whys method is often used. The essence of the Five whys methodology is to consistently ask 5 questions that begin with the word “Why”. Each question is added to the answers to the previous one.
This tool assumes that 5 questions are enough to identify the true cause of the situation that occurred. But this is a fairly conditional figure. If you have asked 5 questions, but have not yet come to a logical conclusion, then you need to continue. But do not get carried away, since the main goal is to find the cause, and not to collect a lot of complaints and dissatisfactions.
If the information received is not enough to understand the situation, participants can contact other employees of the enterprise to find out the missing details.
Analysis
At this stage, the template is filled in and now it is necessary to understand exactly where and what exactly among the highlighted reasons is the key one.
Solution
When the root cause is found, we determine corrective actions to eliminate the problem. It is necessary to make a plan with deadlines and a responsible person, otherwise, the diagram will not work.
Despite the fact that the method was originally created to improve production processes, now it is a universal tool and is used in various fields of activity like marketing or sales. Identifying the root cause of the problem will help you save your money and time and direct your efforts in the right direction.
Find more analytical and strategic marketing information to improve your business performance in the corresponding sections of the website.