The digital economy and cryptocurrencies are going through a period of transformation and some confrontation with financial and government institutions, despite the acceptance by the majority of the numerous advantages of cryptocurrencies. Such an ambivalent situation is connected primarily with the desire to regulate financial flows and counteract illegal activities, along with desire of some states to replenish the budget with taxes.
Private companies are looking towards digital assets
Crypto trading volumes are surging, numerous private companies and investors are looking towards digital assets, multiple ETFs are applying for registration, micro-credit companies are being founded to invest in cryptocurrencies.
MicroStrategy invested in the main cryptocurrency more than $ 15 million (average Bitcoin price ~$57,000).
The Open Interest Rate for Bitcoin futures is also growing, on the largest US largest futures exchange operator – CME. This is due to the uptrend and the expectation of its continuation and speculation by traders who have opened short positions.
This article provides an prices analysis and a cryptocurrencies forecast for 2022. The most promising cryptocurrencies are BTC(Bitcoin), ETH(Ethereum), XRP (Ripple), and XLM(Stellar).
BTC (Bitcoin) Analysis
Bitcoin, BTC to USD, rose by 13.37% in the week ending 10th October. Following a 11,70% rally from a week prior. Bitcoin ended the first week of trading at $ 54,600 – $ 54,700.
Bitcoin has grown by more than 26%
Bitcoin had grown by more than 26% by mid-October 2021, despite a drop by 7% in the previous month. Traditionally, September is known for a market correction around several years.
Staying away from the first major support level at $42 000 – $43 000, that was overcome at the very beginning of October, Bitcoin rallied to a Saturday week high and on 10th October it was already at $ 56,450. According to Glassnode, the resulting contraction in price was associated with investors who bought cryptocurrency at a higher rate between August and September and wanted to lock in profits.
In spite of a pullback to sub-$55,000 levels, Bitcoin closed out the week above the second major resistance level.
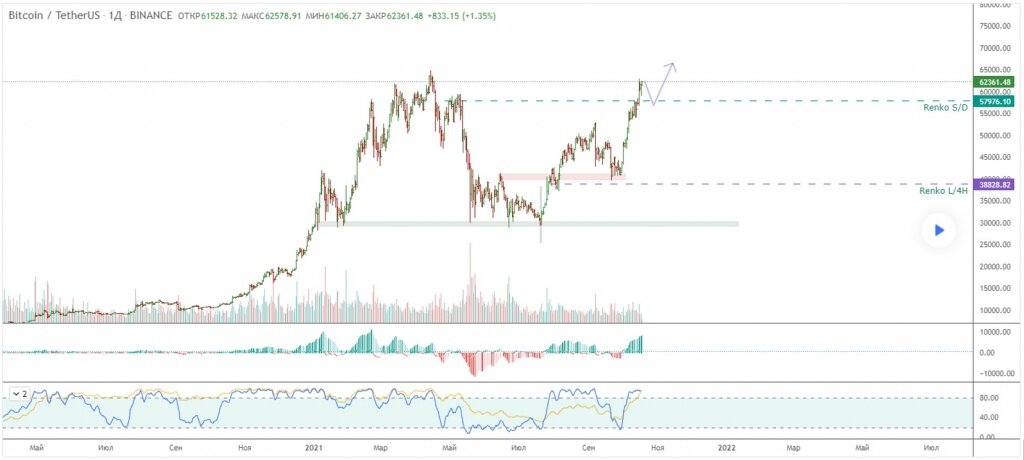
Bitcoin ended the week at $54.900 above support level. The price increase was not preceded by consolidation, which some expected around $49,500. The uptrend continued after the exponential moving average (50 EMA) test on the four-hour chart. The resistance in the area of the 0.236 Fibonacci retracement level ($56,454), which acted as the nearest target of the growth momentum, was broken by the bulls. After that, the asset managed to set a new local maximum at $58.548. The last time Bitcoin was traded at this mark was in May 2021. Since October 17th, Bitcoin has been trying to gain a foothold in the area of the previously established local maximum – $ 62,000- $63,000. Trading activity decreases when the price increases, which increases the probability of a rollback. It is assumed that a couple more attempts to exit the trading channel upwards and then roll back to the support level at $61,450, after consolidation above which the bulls will again go on an active offensive, contributing to the movement to $63,500 and above.
Bitcoin Forecast For 2022 From Financial Experts
Basically, opinions regarding the BTC exchange rate in 2022 are positive. This is not surprising, the asset has good consolidation indicators, and over the past weeks it has shown stable growth. Many authoritative figures of the world market, such as James Patrick Gorman, Lawrence Fink, as well as other analysts and market players, recognize the value of Bitcoin and other cryptocurrencies as assets and means of payment. Also, a large number of so-called "whales", for example, hodlers, continue to purchase Bitcoin. Only at the end of September and the beginning of October, about 150,000 BTC was purchased.
Stripe and El Salvador Support Bitcoin
The adoption of Bitcoin as legal tender in El Salvador, where Bitcoin ATMs were even installed in September, hinted at such promising developments of Bitcoin. Furthermore, Twitter has launched a function for transferring tips inside the platform to Bitcoin.
The statement of the Stripe payment system about the integration of Bitcoin into its service was also good news, although three years earlier the company's management decided to abandon cryptocurrencies.
Stripe conducted experiments on the introduction of cryptocurrencies into its service back in 2014. Nevertheless, refusing to use Bitcoin and other cryptocurrencies in his service, Stripe president John Collison expressed his confidence in the effectiveness of cryptocurrencies as a means of payment.
One of the largest banks in America, Bankcorp Inc, has announced its plans to launch custodial services for fund managers. The combination of such conditions encourages operators of payment systems to use cryptocurrencies in their services, because this allows them to reach more users. This trend only keep growing in the near future.
The First Bitcoin ETF and the possibility of asset correction
A slight correction is expected in the first half of 2022 for BTC. The possibility of such a correction is due to the desire of traders to lock in profits, the SEC approval of the first Bitcoin ETF, as for example it was in 2017, when it was announced the release of Bitcoin futures on the CME exchange. The main support levels in the case of an asset fall are 55200, 51000, 49500 and 47300. If these levels fail, then we are waiting for a decline to $ 42200, $ 31500-31200. Next, we can consider the levels of September 2020.
Especially for you, we have prepared a table of predicted BTC levels and its profitability:
cryptocurrency forecast
Ethereum (ETH)
The asset started a further rise above the resistance levels of $ 3,700, having managed to gain a firm foothold in the area of $ 3100-3800. The nearest support zone is in the area of $ 3500-2900. The next resistance level is $4000. In comparison with BTC, the price of Ethereum has not changed much.
Keeping Ethereum at the $3000 level and its rocketing to $5000
A drop below $3,000 reopens the prospect that the intermediate, wider range of $2,700-$3,300 will be put to the test of strength at the bottom. Looking at the dynamics of the chart at the moment, it seems that this will not require too much effort. However, as we know, there is a significant interest of the bulls in ensuring that this does not happen.
There is a cyclical retest of the resistance level of $ 4100-4500, which may be broken and soon we will see ETH at $ 4900, as Tom Lee from Fundstrat says. His assumption is based on the increasing volumes of the DeFi industry, which is based on Ethereum.
Many analysts predicted that ETH would grow after major upgrade accompanied by the ”burning" of coins (Hard Forks called Berlin and London). Therefore these upgrades reduce the growth rate of the Ethereum supply, if demand increases, their price will increase too. These assumptions can be considered justified by looking at the weekly chart of the asset in the pairs ETH/USD and ETH/USDT, despite the retest of the support area at $ 2900-2700.
XRP (Ripple)
The project launched in 2012, called Ripple (formerly XRP Ledger) has experienced many storms in the crypto market. It is worth saying that the project is open source and based on distributed ledger technology.
The differences between XRP lie in the distributed ledger and the distributed consensus mechanism. The XRP currency does not use the PoW algorithm (i.e. does not require mining), consensus, in turn, does not require multiple confirmations for the immutable transactions. These advantages make it faster and more efficient than some other cryptocurrencies.
Ripple executives claim that the project embodies heritage and values based on the principles of economic justice and opportunities for all through research, education and charity.
A long way - $2 for Ripple
in terms of technical analysis, the historical path of the XRP cryptocurrency is quite interesting. Initially, XRP launched in the cryptocurrency market with a modest $0.0058 per coin and continued to stay in this zone for several months. Later, the news came out that the Ripple network merged with Tokyo-Mitsubishi Bank in 2017, which strengthened the asset position.
From the end of December 2017 to March 2018, XRP grew steadily, but then the main players, such as BTC (Bitcoin), ETH (Ethereum) and LTC (Litecoin) and others who took a tight place in the cryptocurrency market lowered it to less than half a cent per coin. The decline continued until 2020, XRP was even 14 cents per coin An important, and maybe even the main role in such a fall was played by the claims of the US Securities and Exchange Commission and the court proceedings, which greatly shook the confidence of depositors.
If we look at the price movement of XRP during this period, the currency was trading at a market value of 0.25 USD, with a market capitalization of 9, 206, 907,569 USD in January 2020. Later, Ripple showed a small boost. The XRP price has reached its resistance levels above $0.25.
Ripple price has risen by 150% since 2020
Since the beginning of March 2020, the price of Ripple has increased by almost 150% from its starting price to around $ 0.7. However, the asset did not hold the level and began a sharp decline. By the end of December 2020 its price had fallen to $0.17.
However, since June 2021, XRP has recovered in price and is now trading in the range from 1.2 to 0.9 dollars per coin, demonstrating stability in terms of price, market capitalization and market sentiment.
Ripple has received support from some major investment companies
A number of cryptocurrency firms also want to cooperate with Ripple. This shows that many are positive about the prospects of XRP. According to recent forecasts and price movement dynamics, XRP may receive a significant boost by the end of the year.
Now the confident support zone is 1.07-1.01$ . There is an increase in sales with a retest of the lower boundary of the support. zone. The last major purchases were about a week ago, which indicates a confident retention of the support level. The RSI is at the level of 51-52, which indicates the possibility of entering a deal, when the asset is locked in above the level of 1.59-1.61 $. Further, if the bulls continue to purchase, the strong resistance level $1.96 will be reached.
XLM (Stellar)
Stellar (XLM) is an open-source network for currencies and payments that is built on blockchain technology to interact with global financial systems using its own asset.
Issue of assets on the Stellar blockchain
The Stellar blockchain allows anyone to release new assets on the network and exchange them for other assets. Assets on Stellar are issued and redeemed by anchors, who are trusted entities. Anchors enable real world assets to be exchanged on Stellar by leveraging a distributed exchange that maintains an order book for every asset pair. Stellar supports the issuance of any type of asset including stocks, currencies, cryptoassets and etc.
Having reached its minimum in September 2021 at $ 0.2601 per coin, the asset has changed the trend on the weekly chart and is now represented by three candles with good volumes, but shadows on top.
Comparing exponential moving averages, the XLM coin is trading below the 100-day and 200-day EMA, critical EMA, which indicates the continuation of the bearish trend. However, with the current price movement, the coin returned the level of the 50-day EMA line.
When is it time to buy XLM?
The RSI indicator is at 53, which indicates a slight strengthening of buyers. From a technical point of view, XLM has demonstrated a significant drop in its value, and the trend cannot be clearly defined at the moment. There are opportunities for the cryptocurrency growth, as the formation on the chart is very similar to the double bottom pattern. As soon as a price breakout ($0.43) is noticed in the neck area of this pattern, certain entry points into transactions can be considered. The longer-term XLM targets will be the $1.20 and $1.53 zones, respectively.
Other Altcoins (Altcoins)
After the announcement of the SafePal airdrop project, together with DreamQuestNFT, the cost of SFP increased by 130% (against the dollar). The integration of Visor Finance with the Futureswap platform has caused VISR to grow by 35% (against the dollar). The Opulous project listing on the MEXC exchange led to an increase in the price of OPUL by 20% (against the dollar).
The total capitalization of the cryptocurrency market increased by 4.85%, the dominance of Bitcoin increased by 0.6%.
The analytical company Coin Metrics, in a review of non-fungible tokens (NFT), stated that today they account around 16% of the total daily activity on the Ethereum network, although at the beginning of the year they were only 1%.
* The information contained in this article is for generalized informational and educational purposes only and is not designed to provide financial advice.
you may find these articles helpful: