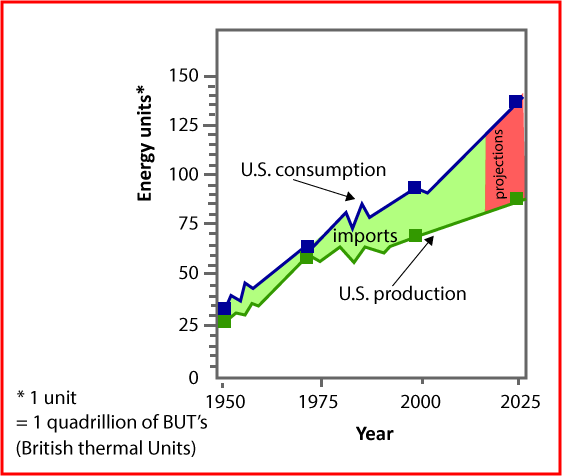
The graph below compares figures for the production and consumption of energy in the US from 1950 to 2000. It also predicts figures for 2025. The given chart below illustrates the prediction and real energy rate during 1950 to 2000, moreover there are two continuation for this chart. The first one shows the prediction which had been constructed on their predictions bases, whereas there is the second choice which has been constructed on basis of real numbers. Including this fact that energy rate has been written by 1 unite which is equal to 1 quadrillion of BUT’s. As we can see the predicted energy rate which is given in units started from 25 unites and doubled in 1975. In the start of 21 century they predicted that the rate of energy would be 65 unites, furthermore in 2025 it would reach to 75 unites. Nevertheless, the predication was fair away from real numbers, while the starting rate was same. But in 2000 the real numbers rate was boomed and reached to 90 unites. Furthermore the predication which was made on the real numbers base show that in 2025 the rate of energy would climb to 140 unites.