Найти тему

EEG resting state microstates ABCD

Оглавление

Electroencephalography (EEG) is a powerful method of studying the electrophysiology of the brain with high temporal resolution. Several analytical approaches to extract information from the EEG signal have been proposed. One method, termed microstate analysis, considers the multichannel EEG recording as a series of quasi-stable "microstates" that are each characterized by a unique topography of electric potentials over the entire channel array. Because this technique simultaneously considers signals recorded from all areas of the cortex, it is capable of assessing the function of large-scale brain networks whose disruption is associated with several neuropsychiatric disorders.

ABCD resting state model is created to describe state of the central part of the thalamus:

  • A, B – calm state;
  • C – flashes;
  • D – tonic impulses.

On the power spectrum graphs ABCD-states can be separated by dominant frequencies bands and their total power:

On the power spectrum graphs ABCD-states can be separated by dominant frequencies bands and their total power

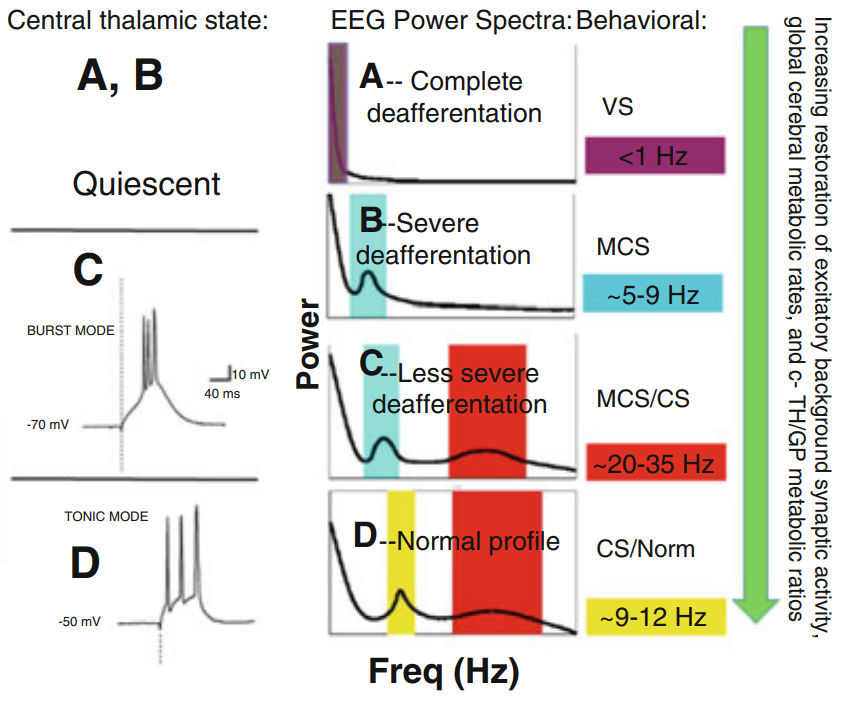
In the clinical practice ABCD model is now used for diagnosis of such disorders as autism, schizophrenia, dementia, panic disorder, but especially usefull this model for diagnosis and prognosis of patients in Intensive Care Units (ICU). According to dominant microstate it is possible to understand brain stftus of the patient in ICU.

According to dominant microstate it is possible to understand brain stftus of the patient in ICU
  • А - vegetative state / unresponsive wakefulness syndrome.
  • B - vegetative state / unresponsive wakefulness syndrome / minimal conscious state.
  • C - minimal conscious state / confusional state.
  • D - confusional state / normal state / healthy.

In psychiatry not only ABCD-states are analysed, but also transitions from one state to another.

In psychiatry not only ABCD-states are analysed, but also transitions from one state to another

Clinical cases

Case 1:

Healthy person, dominant alpha rhythm ~10 Hz in occipital area, microstate D is dominating during whole record according to ABCD trend (pink color):

Healthy person, dominant alpha rhythm ~10 Hz in occipital area, microstate D is dominating during whole record according to ABCD trend
Healthy person, dominant alpha rhythm ~11 Hz in occipital area, microstate D is dominating during whole record according to ABCD trend

Case 2:

Person with epilepsy, dominant alpha rhythm ~10.5 Hz in occipital area, microstate D is dominating on some parts of recording according to ABCD trend (pink color), but also microstate C is often dominating (yellow color):

Person with epilepsy, dominant alpha rhythm ~10.5 Hz in occipital area, microstate D is dominating on some parts of recording according to ABCD trend (pink color), but also microstate C is often dominating (yellow color)

Case 3:

Patient in ICU, lots of beta activity on EEG, confusional state, microstate C is dominating during recording according to trend (yellow color):

Patient in ICU, lots of beta activity on EEG, confusional state, microstate C is dominating during recording according to trend (yellow color)

Case 4:

Patient with epilipsy, theta activity on EEG, beta is also presents, but no alpha. Microstate C is dominating during recording according to trend (yellow color):

Patient with epilipsy, theta activity on EEG, beta is also presents, but no alpha. Microstate C is dominating during recording according to trend (yellow color)

Case 5:

Patient in ICU, vegetative state, slow activity dominating during whole record. Microstate A is dominating during recording according to trend (violet color):

Patient in ICU, vegetative state, slow activity dominating during whole record. Microstate A is dominating during recording according to trend (violet color)

Case 6:

The patient remains unconscious in the intensive care unit for a long time. Microstate A dominates:

The patient remains unconscious in the intensive care unit for a long time. Microstate A dominates

Reference